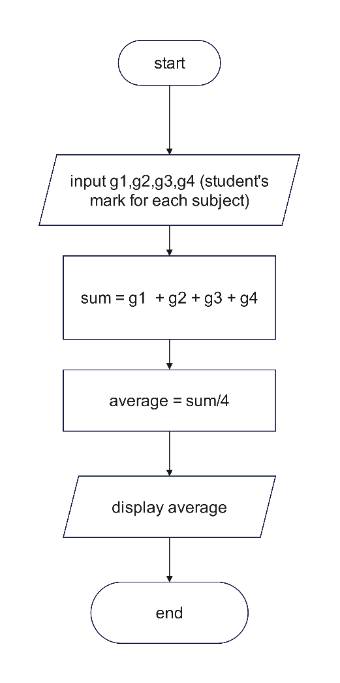
This is a Program Flowchart for Student Grade Average Calculation. It details the sequential steps: starting the process, inputting four subject marks (g1, g2, g3, g4), calculating their sum, deriving the average (sum divided by 4), displaying the average, and ending the process. Suitable for educators, students, or anyone needing to compute grade averages, this flowchart offers a clear, visual guide to the calculation logic.


 Desktop