
Templates Community /
Construction Schedule Gantt Chart PPT Template
Construction Schedule Gantt Chart PPT Template
PlotWizard
Published on 2026-04-30

 Desktop

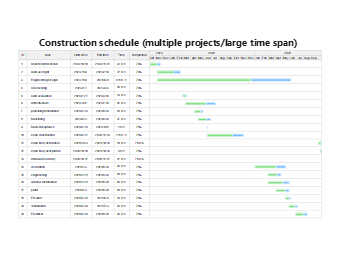
This “Construction Schedule Gantt Chart PPT Template” is designed for project managers, engineering professionals, PMO teams, and business leaders who need to manage complex project timelines. It is ideal for construction scheduling, multi-project coordination, progress tracking, and full lifecycle project management.
The template is built around a standard Gantt chart structure, combining timeline visualization with detailed task breakdowns to present complex project schedules in a clear and organized manner. It covers the entire project lifecycle, including early-stage planning (investment decisions, land approvals), mid-stage execution (infrastructure, main construction, installations), and final stages (decoration, inspection, and acceptance).
Each task includes key data fields such as start date, end date, duration, and completion percentage, enabling project managers to monitor progress accurately. The cross-year timeline (spanning multiple years, such as 2023–2025) makes it especially suitable for large-scale and long-term projects.
With visual progress bars indicating completion rates, users can quickly identify delays and potential risks, allowing for timely adjustments. This template is particularly useful for managing multiple parallel projects or complex workflows, improving coordination and execution efficiency.
From a project management perspective, it supports task dependency analysis, resource allocation, and schedule optimization, helping managers make informed decisions. It is also highly effective for reporting purposes, such as progress updates, project reviews, and executive presentations.
The design features a clean and professional layout tailored for engineering and project management use.
Tag
Project Management Collection
Multi-Project Gantt Chart
Project Schedule Management
Construction Gantt Chart Template
Share
Report
0
12

Post
Recommended Templates
Loading
