
Templates Community /
Data Visualization Slides
Data Visualization Slides
PlotWizard
Published on 2026-04-30

 Desktop

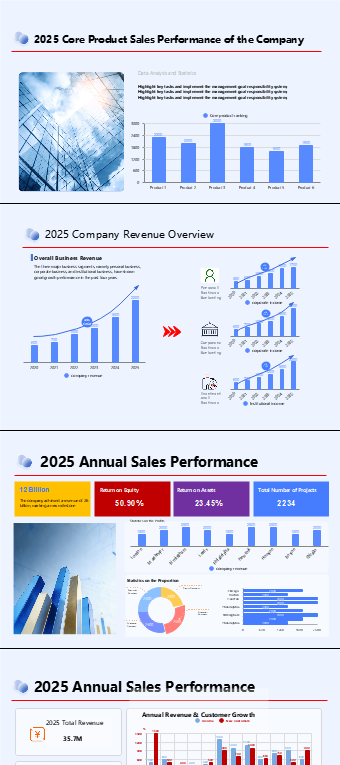
This “Year-End Sales Data Analysis PPT Template” is designed for sales teams, operations professionals, data analysts, and business managers who need to present clear and insightful reports. It is ideal for annual performance reviews, sales data analysis, business reporting, and strategic planning presentations.
The template focuses on combining sales analysis with powerful data visualization to help users effectively summarize annual achievements and communicate growth strategies. It includes comprehensive modules such as overall sales performance, core product sales analysis, revenue trend overview, channel comparison (online vs. offline), and target achievement tracking.
With a variety of visual elements including bar charts, line graphs, dashboards, and pie charts, complex data is transformed into intuitive visuals. Users can easily present product rankings, revenue growth trends, and performance across different business segments, enabling decision-makers to quickly understand key insights.
In addition, the template supports multi-dimensional analysis, such as traffic-based sales conversion, gender-based sales distribution, and product sales proportion. These features help businesses gain deeper insights into customer behavior and market performance. Quarterly performance tracking and annual goal comparison modules further enhance the structure and clarity of the presentation.
The design adopts a modern blue business style with red highlights, ensuring a professional and impactful visual appearance. The clean layout and well-organized content hierarchy allow users to simply replace text and data to create high-quality presentations quickly, improving productivity significantly.
Tag
Data Visualization PPT
Sales Data Analysis PPT
Slide Decks
Annual Performance Report
Share
Report
0
14

Post
Recommended Templates
Loading
