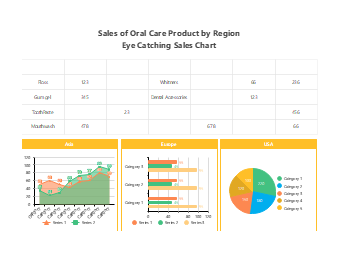
This regional oral care product sales analysis template is designed for scenarios such as multi-region product sales data comparison, category sales performance analysis, market sales report production, and business data visualization, serving as a practical tool in the field of retail and FMCG industry business analysis. Adopting a combined design, the upper part presents sales data of different categories such as floss toothpaste and mouthwash through a table, and the lower part is paired with three types of charts including line chart bar chart and pie chart to show the sales situation in three major regions including Asia Europe and the United States, clearly presenting the sales trend category comparison and market share of each region, intuitively showing the product sales differences and market performance in different regions, adapted to the visualization needs of multi-region sales data comparison and business analysis. FMCG industry business analysts, sales operation personnel, marketing planners, and data visualization designers can use EdrawMax to quickly adjust table data, modify chart content, and replace color schemes to adapt to various scenarios such as regional sales data comparison analysis, category sales performance document production, market sales report presentations, and project plan displays. The design combining multiple charts makes data comparison more intuitive and clear, providing data references for regional market strategy formulation and product sales optimization.


 Desktop