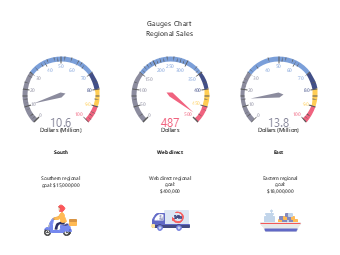
This gauge chart template for regional sales performance analysis is designed for scenarios such as corporate sales data analysis, quarterly performance reports, e-commerce operation reviews, and business decision-making meetings, serving as a professional data visualization tool in the field of sales management. Adopting the gauge chart type, the template uses three independent gauges to present the actual sales volume and target completion status of the South region, East region, and web direct sales channel, paired with performance target descriptions and delivery scenario icons at the bottom to intuitively show the performance achievement rate and data comparison of different sales channels. Sales managers, operation personnel, market analysts, and corporate managers can directly use EdrawMax to quickly edit the template, replacing sales data, adjusting target values, and modifying color schemes to adapt to various scenarios such as regional sales performance monitoring, e-commerce channel performance comparison, sales target completion analysis, and business report data display. Without designing charts from scratch, users can efficiently complete sales data reviews and performance reports, helping to clearly present sales performance differences and enhance the professionalism and persuasiveness of sales management and business decision-making.


 Desktop