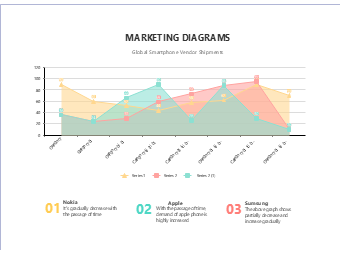
This global smartphone vendor shipments trend analysis chart is a professional visualization template designed for consumer electronics market data comparison and brand performance analysis. It intuitively presents the shipment volume trends of three major brands (Nokia, Apple, Samsung) over time, clearly comparing the market performance and data fluctuations of different brands in the form of a stacked area chart, fully showing the application logic of trend analysis charts in consumer electronics market research. The template comes with coordinate axes, data point markers, legend descriptions and brand feature interpretation modules, eliminating the need to design the framework from scratch, allowing for quick and professional typesetting directly after application. It is widely applicable in scenarios such as writing consumer electronics market reports, demonstrating brand market performance, making classroom marketing data analysis teaching courseware, interpreting at industry trend seminars, creating market research graphics and texts, and assisting in brand market strategy planning analysis. With this template, the shipment volume change trends, market share changes and development status of different brands are intuitively presented, helping users quickly sort out the industry development context.


 Desktop