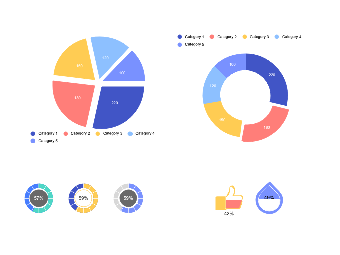
This template displays a collection of data visualization charts, which are crucial tools for statistical analysis and business intelligence reporting. It features a pie chart and a donut chart, both of which are instrumental in breaking down categorical data into understandable segments. These visualizations are often used to communicate complex data in a clear and effective manner, making them invaluable for presentations, reports, and educational resources.



 Desktop