
Templates Community /
Optimization algorithm comparison template
Optimization algorithm comparison template
adten4u@yahoo.co.uk
Published on 2023-04-24

 Desktop

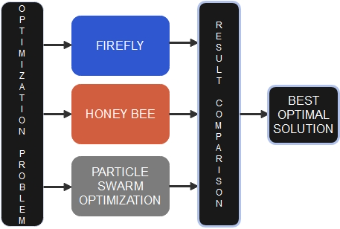
This flow - chart template for comparing optimization problem solutions, easily drawn with EdrawMax, plays a vital role in scenarios involving the application of various optimization algorithms and solution selection.The chart presents three common optimization methods: FIREFLY, HONEY BEE, and PARTICLE SWARM OPTIMIZATION. The Firefly algorithm conducts optimization searches by simulating the luminescence behavior of fireflies, suitable for complex, multi - peak function optimization problems and a good choice for researchers exploring new optimization strategies. The Honey Bee algorithm imitates the honey - collecting behavior of bees, showing good global search ability in finding optimal solutions, often used in logistics distribution path optimization and resource allocation, ideal for practitioners in related industries. The Particle Swarm Optimization algorithm, inspired by bird flocking behavior, has advantages such as fast convergence and simple parameter settings, widely used in machine learning model parameter tuning and a common tool for machine learning engineers.After these algorithms process the optimization problem, the results are input into the result comparison module. Through comparison, the performance differences of different algorithms in solving the same optimization problem become clear, helping to select the best optimal solution. This template, in the form of a flowchart, has a clear structure and logic, facilitating user understanding and analysis of the characteristics and effects of different optimization algorithms. Whether for academic research, algorithm teaching, or solution selection in actual engineering projects, this template provides effective support to help users make quick decisions and improve work efficiency.
Tag
flowchart template
Solution selection tool
Optimization algorithm comparison template
Share
Report
0
1

Post
Recommended Templates
Loading
