Templates Community /
Project Gantt Chart Overview
Project Gantt Chart Overview
Mason·Carter
Published on 2025-12-19
Generate Diagram with AI
Template
Desktop
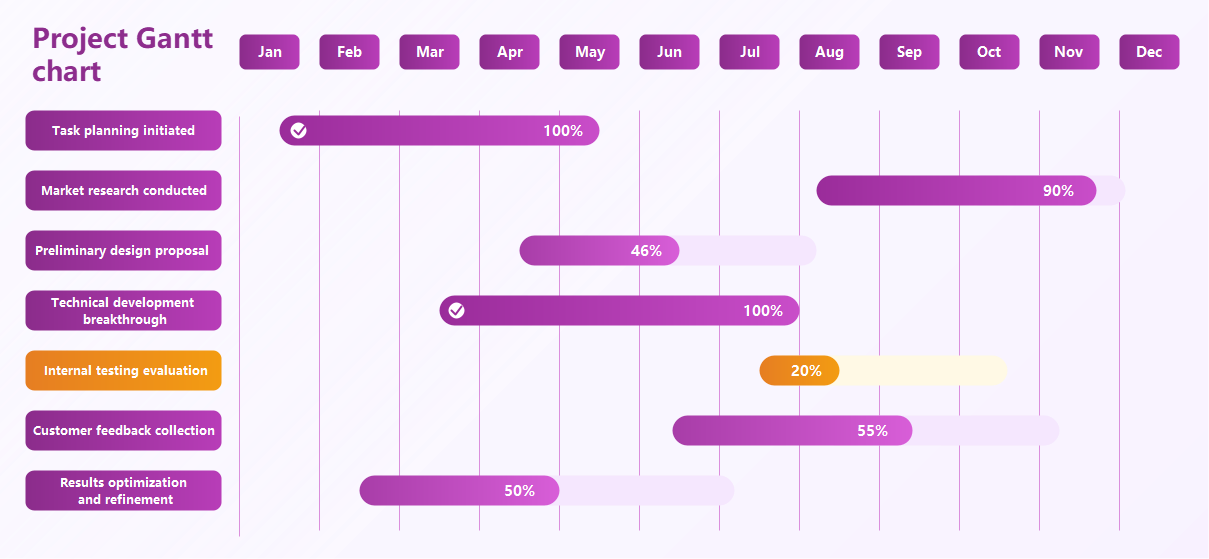
A project timeline Gantt chart showing the progress of tasks from January to December, displaying stages such as task planning, research, and testing, with completion percentages.
Tag
Business Chart
Project metrics
Project planning
project progress
Project Stages
Project Timeline
Project Tracking
Task Management
Timeline Visual
Gantt Chart Template
Share
Report
1
109
Add a comment
Post
Recommended
Templates
Loading
Close
Close


 Desktop