
Templates Community /
Project Implementation Gantt Chart Template
Project Implementation Gantt Chart Template
PlotWizard
Published on 2026-04-30

 Desktop

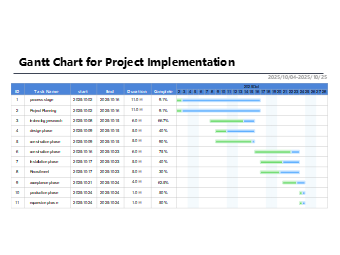
This “Project Implementation Gantt Chart Template” is designed for project managers, PMO teams, product managers, and business professionals who need to manage execution-phase tasks effectively. Built on the classic Gantt chart structure, it visualizes project implementation processes through a clear timeline, helping teams achieve structured planning and efficient execution.
The template focuses on key stages of project implementation, including process stage, project planning, technology research, design phase, construction/execution phase, installation phase, recruitment, acceptance phase, production phase, and expansion phase. Each task includes essential information such as start date, end date, duration, and completion percentage, while horizontal bars visually represent progress for easy tracking.
The timeline is organized by specific dates (e.g., October 2 to October 28), making it ideal for short-term project execution and detailed scheduling. By displaying multiple tasks simultaneously, it highlights dependencies and execution flow, enabling project managers to identify critical paths, optimize task sequences, and allocate resources efficiently.
In practical scenarios, this template is widely used in IT project implementation, engineering execution, system deployment, product rollout, and internal business operations. It supports task breakdown, progress monitoring, issue tracking, and performance evaluation, ensuring better control over project execution.
The layout is clean and professional, combining structured data tables with visual timelines to enhance clarity and usability. All elements are fully customizable, allowing users to adapt tasks, schedules, and progress data according to real project requirements.
Whether used in agile execution environments or traditional project management frameworks, this project implementation Gantt chart template helps teams achieve precise scheduling, real-time monitoring, and efficient delivery, making it an essential tool for successful project execution.
Tag
Project Execution Management
Project Implementation Gantt Chart
Project Management Collection
Project Progress Tracking Tool
Share
Report
0
16

Post
Recommended Templates
Loading
