
Templates Community /
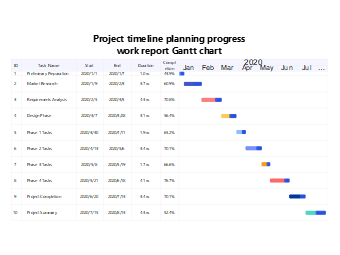
Project Timeline Planning Progress Work Report Gantt Chart with Phased Task Tracking Template
Project Timeline Planning Progress Work Report Gantt Chart with Phased Task Tracking Template
Published on 2026-05-19

 Desktop


Post
Recommended Templates
