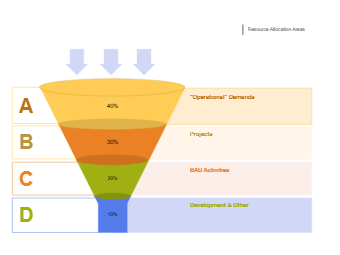
This template is a resource allocation funnel diagram. At the top of the funnel (A), "Operational" Demands receive 40% of the resources, indicating their high - priority status in business operations. The next section (B) is for "Projects", which are allocated 30% of the resources. Moving down, "BAU (Business As Usual) Activities" in section C get 20% of the resources. The smallest portion at the bottom (D), "Development & Other", is allocated 10% of the resources. This diagram visually represents how resources are distributed among different aspects of a business, helping managers and stakeholders understand and plan resource utilization effectively.


 Desktop