
Templates Community /
Sales Data Analysis and Performance Report Business Slides
Sales Data Analysis and Performance Report Business Slides
PlotWizard
Published on 2026-04-30

 Desktop

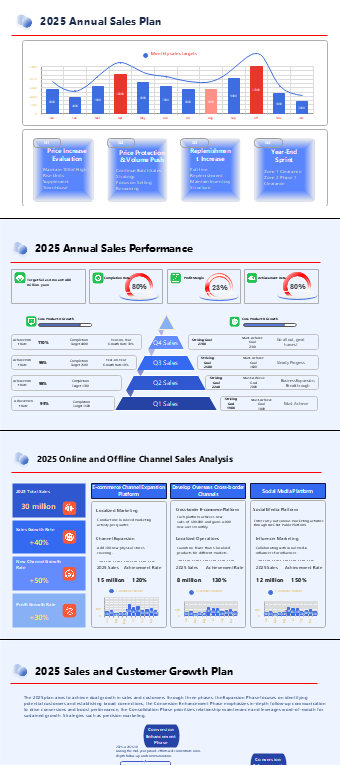
This “Annual Sales Plan Data Visualization PPT Template” is designed for sales teams, marketing professionals, business analysts, and corporate managers who need to present structured and data-driven reports. It is ideal for annual sales planning, performance reviews, business analysis, channel strategy presentations, and executive-level reporting.
The template provides a comprehensive framework for sales management and analysis, including monthly sales target trends, quarterly strategy breakdowns (Q1–Q4 planning), and key performance metrics such as completion rate, profit margin, and growth rate. With a variety of visual elements such as bar charts, line graphs, dashboards, and proportion charts, complex data can be presented in a clear and intuitive manner, helping decision-makers quickly grasp business performance and trends.
In addition, the template includes modules for online and offline channel sales analysis, e-commerce expansion strategies, cross-border business development, and social media marketing planning. These sections enable users to analyze sales growth from multiple perspectives and optimize channel strategies effectively. The inclusion of revenue structure analysis and product performance insights further strengthens the depth and professionalism of the presentation.
Visually, the template adopts a clean and modern business style with a blue-gray color scheme, making it suitable for formal presentations. The modular layout ensures clear information hierarchy, allowing users to simply replace text and data to create high-quality slides efficiently. Fully compatible with PowerPoint and WPS, it is easy to use and ideal for daily business reporting.
If you are looking for a professional and practical PPT template that integrates sales planning, data analysis, and performance reporting, this template is an excellent choice to enhance your presentation impact and productivity.
Tag
Data Visualization PPT
Slide Decks
Performance Report Presentation
Sales Data Analysis PPT
Share
Report
0
30

Post
Recommended Templates
Loading
