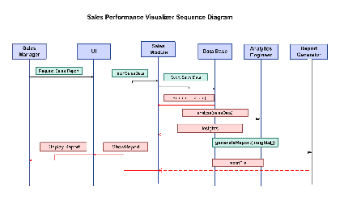
Designed with EdrawMax, this template is a sequence diagram for a Sales Performance Visualizer. It shows the interactions between various components such as the “Sales Manager,” “UI,” “Sales Module,” “Data Base,” “Analytics Engineer,” and “Report Generator.” The process begins when the “Sales Manager” requests a sales report. The “UI” then fetches sales data from the “Sales Module,” which queries the “Data Base.” The retrieved sales data is analyzed by the “Analytics Engineer” to generate insights. These insights are used by the “Report Generator” to create a report file, which is then displayed by the “UI” for the “Sales Manager.” This diagram is useful for software developers, data analysts, or sales managers, providing a clear visual representation of the data flow and interactions involved in generating a sales performance report, aiding in system design and understanding.


 Desktop