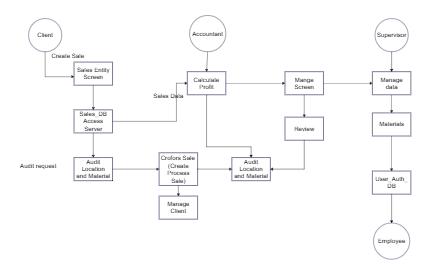
Designed with EdrawMax, this template is a data flow diagram for the sales process. It begins with a “Client” creating a sale through the “Sales Entity Screen,” which interacts with the “Sales_DB Access Server.” Sales data is then used by an “Accountant” to “Calculate Profit.” The process includes steps like “Manage Screen,” “Review,” and “Manage data” by a “Supervisor.” There are also audit - related functions such as “Audit Location and Material” triggered by an “Audit request.” The diagram shows how different entities like “Employee,” “Materials,” and “User_Auth_DB” are involved in the overall sales process. This diagram is useful for business analysts, system designers, or sales managers, providing a visual representation of the sales process data flow and interactions among various components for process optimization and system improvement.


 Desktop