Community
Collections
Collections
Challenge
Online Use
Download
Pricing
Publish
sign in
sign up
Template Community
/
Deployment Diagram E
Deployment Diagram E Templates
Discover, learn, and get inspired by
0+
of free editable templates for your next project!
Popular
Loading
Edit online
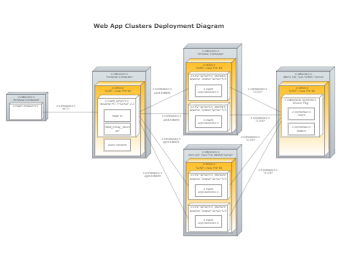
Web App Clusters Deployment Diagram
hokyinyiu9702
309
46
3
Close
Close