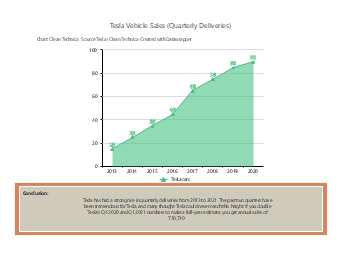
This area chart is a professional data visualization template designed for sales data analysis in the automotive industry, focusing on the changes in Tesla's quarterly deliveries. It uses a filled area structure with data point markers to intuitively present the continuous growth trend of sales from 2013 to 2020, clearly showing the growth rate and market expansion rhythm at different stages. The template comes with complete axis labels, year scales, data point value labels, legends and conclusion description text boxes, eliminating the need to design the chart framework from scratch, and allowing users to quickly complete professional typesetting by direct application. It is suitable for a wide range of people, including automotive industry market analysts, new energy vehicle brand operation personnel, college students majoring in marketing and automotive engineering, financial media content creators, industry research report writers and investment analysts. It can be widely used in various scenarios such as writing automotive sales trend reports, analyzing new energy market development, making classroom teaching courseware, creating financial popular science articles, presenting at industry trend seminars and analyzing corporate strategic decisions. It can convert scattered quarterly sales data into intuitive trend area views, helping users quickly sort out the brand's sales growth context, identify key market development nodes, providing professional support for industry research, market strategy formulation and result display.


 Desktop