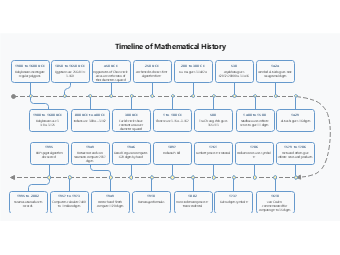
This Timeline of Mathematical History infographic template is a clean horizontal timeline chart designed to visualize key milestones in mathematics and the evolution of pi across centuries. The diagram type is a timeline infographic with rounded milestone cards, connected nodes, and a dashed timeline path, making it easy to present chronological events from ancient civilizations to modern computation. It includes time ranges such as 1900 to 1600 BCE, 1850 to 1650 BCE, 450 BCE, 250 BCE, 200 to 300 CE, 530, 1424, 1429, 1579 to 1706, 1706, 1737, 1761, 1882, 1897, 1910, 1946, 1949, 1957 to 1973, 1995, and 1995 to 2002, covering famous figures and discoveries like Archimedes, Euclid, Liu Hui, Aryabhata, Madhava, Lambert, Euler, Ramanujan, and modern digit records.
Teachers and educators can use it for math history lessons, STEM classes, and lecture slides. Students can use it for research projects, posters, and presentations on the history of mathematics or pi. Researchers, science communicators, and content creators can publish it as a math infographic for blogs, YouTube scripts, and social media. Training teams and academic institutions can adapt it for course modules, workshop handouts, and conference posters.
Use this template for classroom posters, presentation slides, curriculum materials, museum style science displays, math club events, and online articles explaining the history of pi and mathematical progress. It matches high intent searches and evergreen keywords such as mathematical history timeline, history of pi timeline, pi digits timeline infographic, math timeline chart, STEM education infographic, and mathematics history poster template, helping improve template discovery and search indexing.


 Desktop