
Templates Community /
University New Semester Experimental Plan Gantt Chart Template – Scientific Research Progress Management and Scheduling Table
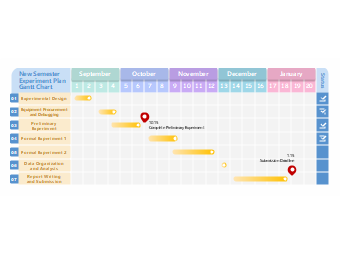
University New Semester Experimental Plan Gantt Chart Template – Scientific Research Progress Management and Scheduling Table
Published on 2026-02-28

 Desktop


Post
Recommended Templates
