Community
Collections
Collections
Challenge
Online Use
Download
Pricing
Publish
sign in
sign up
Template Community /
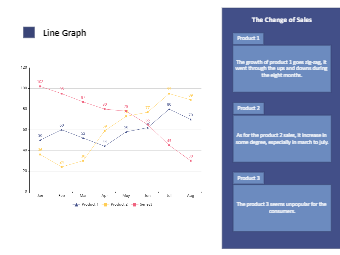
Line Graph
Line Graph
Kiraaaa
Published on 2020-09-16
Download
Download
Download EdrawMax
Edit Online
A line graph, also known as a line chart, is a type of chart used to visualize the value of something over time.
Tag
line graph
line chart
Share
Report
6
683
Add a comment
Post
Recommended
Templates
Loading
Close
Close