EdrawMax Online All Articles
Articles related to diagramming scenario tips and tutorial e-books!
Categories
Start diagramming with EdrawMax Online today—try it for free!
Recommended

HOW-TO & TIPS
8 Minutes
How to Create A Perfect Work Schedule for Your Team
Creating a perfect work schedule may reduce the work pressure, increases productivity, efficiency, and overall business profit. Check this article to know the tips about work schedule!

DISCOVERY
6 Minutes
Electrical Plan 101
So what is an electrical plan? Let's discuss this with its purpose and a bunch of examples. If it is of interest to you, continue reading!

HOW-TO & TIPS
5 Minutes
How to Make A Genogram Online
How to make a genogram online? Check this guide to know how to make a genogram online and some tips about the making genograms. You will find the easiest way to make a genogram!
All Articles
DISCOVERY
5 Minutes
Do you want to speed up your routine, pass the time, or get instant help? Take a look at these five great AI robot apps for your phones.
DISCOVERY
5 Minutes
Want to utilize unstructured customer reviews for better sales and increased conversions? Check out these 8 AI text analytics and automate the analysis process.
DISCOVERY
5 Minutes
Explore some finest AI summary tools to simplify educational and business duties. Learn how you can read and summarize lengthy documents in minutes.

HOW-TO & TIPS
5 Minutes
Optimize project tracking with EdrawMax's AI solutions. Elevate your project management for success.
DISCOVERY
5 Minutes
Discover flexible and adaptable choices for boosting user participation and streamlining assistance. Get ahead of the curve by learning open-source chatbots!
DISCOVERY
5 Minutes
Discover the easiest way to create professional flowcharts with top-rated AI flowchart generators. Simplify complex processes and boost your productivity.
DISCOVERY
5 Minutes
Planning to switch from paper to a digital canvas for mind mapping? Explore these top ten mind map makers and organize effective brainstorming sessions.
HOW-TO & TIPS
5 Minutes
If you want to convey information to the viewers, you can create AI infographics. This article will teach you about making AI infographics using EdrawMax.
DISCOVERY
5 Minutes
Although presentations are effective, but their creation also impacts their message. If you want to accelerate your presentation-making process, utilize these top-notch AI presentation makers.
HOW-TO & TIPS
5 Minutes
AI is the game changer in today's digital world. Let's explore how AI automates the creation of visually appealing diagrams.
HOW-TO & TIPS
5 Minutes
If you are going to opt for Whimsical AI as your ultimate AI-powered diagramming solution, read this review. We have discussed everything about Whimsical AI that may impact your prospective decision.
EXAMPLES & TEMPLATES
5 Minutes
A heartfelt Happy Father's Day card is not just an artwork. This little piece of art carries more than just words; they hold memories, love, sentiments, and appreciation.
HOW-TO & TIPS
5 Minutes
Whether you are a professional designer, mentor, or business professional, AI mind mapping will facilitate the effortless portrayal of complex concepts.
HOW-TO & TIPS
5 Minutes
This article will highlight AI-generated concept maps, their uses, benefits, and creation procedure. Hook up until the end to learn everything about this innovative concept mapping breakthrough.
HOW-TO & TIPS
5 Minutes
Given the emerging trends of AI, this comprehensive guide presents detailed insights into the SheetAI app and covers everything you may need to know about the Sheet AI spreadsheet.
HOW-TO & TIPS
5 Minutes
AI is diverting the attention of the audience because of its incredible innovations. Let's explore how AI technology can help create AI forms.

HOW-TO & TIPS
5 Minutes
The horizons of AI are continuously expanding, leading to evolved solutions. Here's how Artificial Intelligence is making its mark in the flowcharting domain.

HOW-TO & TIPS
5 Minutes
Are you looking for a way to use AI for Google Sheets? You will find this guide quite assistive in exploring how to use AI-powered Chat GPT in Google Sheets.
EXAMPLES & TEMPLATES
5 Minutes
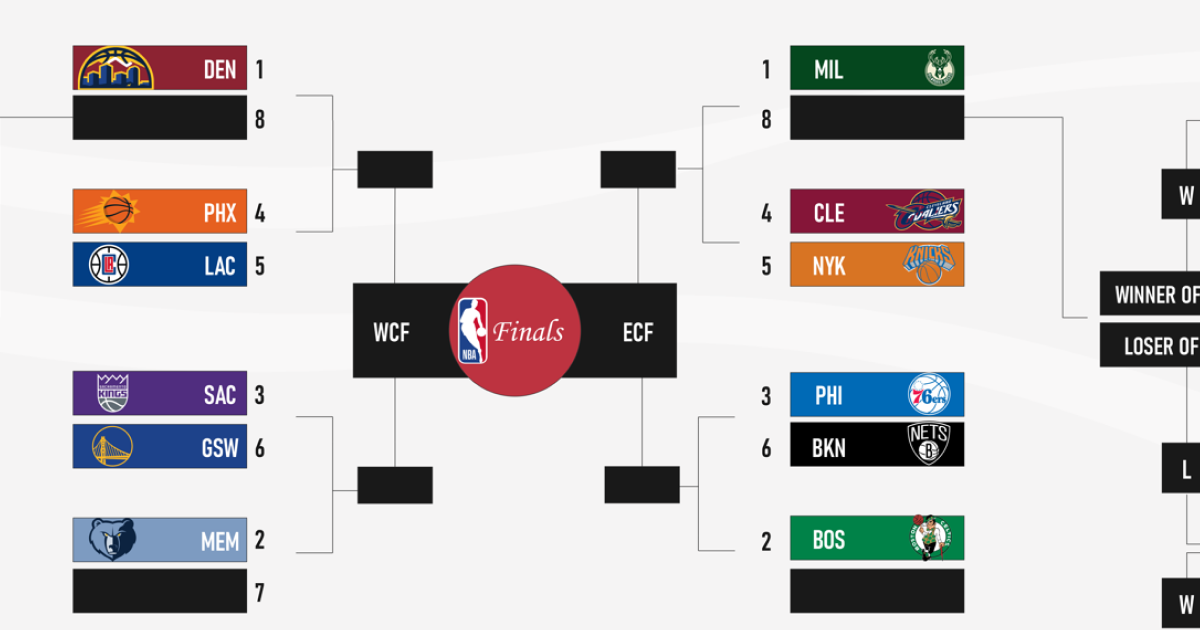
Who will make it to the NBA Finals? Follow the thrilling journey of the 2025 Playoffs with the updated playoff bracket and matchups.

EXAMPLES & TEMPLATES
5 Minutes
Surprise your mom with a stunningly-created Mother's Day card to express your heartfelt emotions, acquiring ideas from these innovative Mother's Day printable card solutions.

DISCOVERY
5 Minutes
This article is a comprehensive guide about what is parallel processing in flowcharts, its relative significance, illustrative examples, and a complete procedure regarding how you can induce a parallel process in your flowchart.
DISCOVERY
5 Minutes
Process map vs. flowchart is a hot subject for businesses around the world. Many people use these terms interchangeably, which often creates confusion. Read more to get a clear idea.
DISCOVERY
5 Minutes
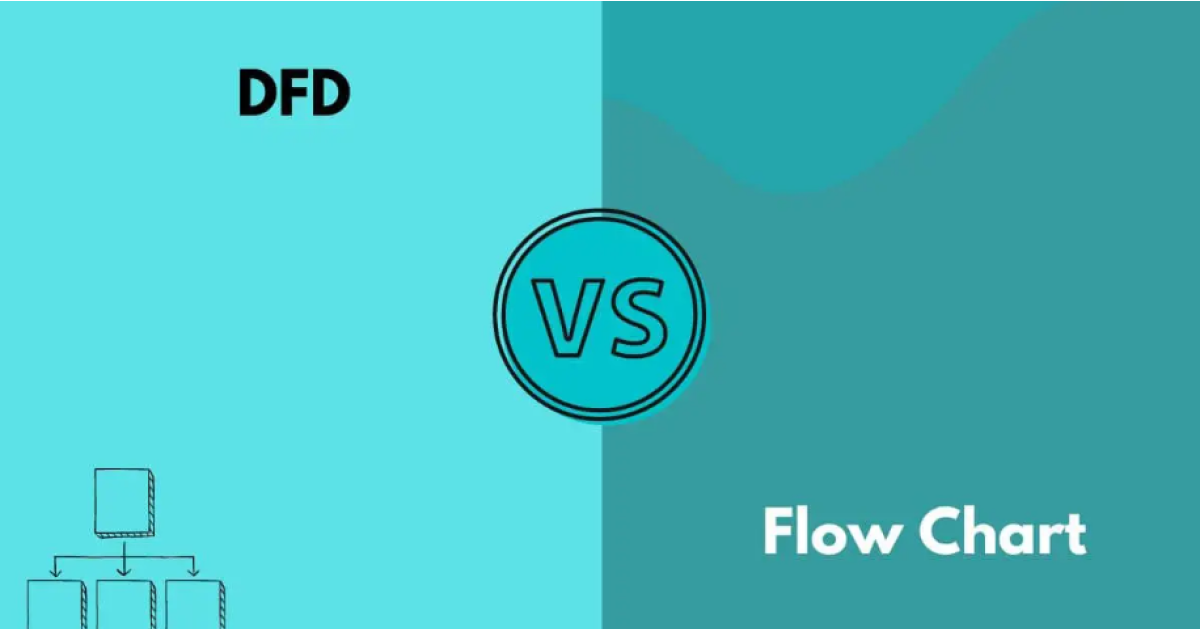
This guide presents a comprehensive discussion on the difference between flowchart and data flow diagram. Read more to know how you can create these diagrams within a few minutes.
DISCOVERY
5 Minutes
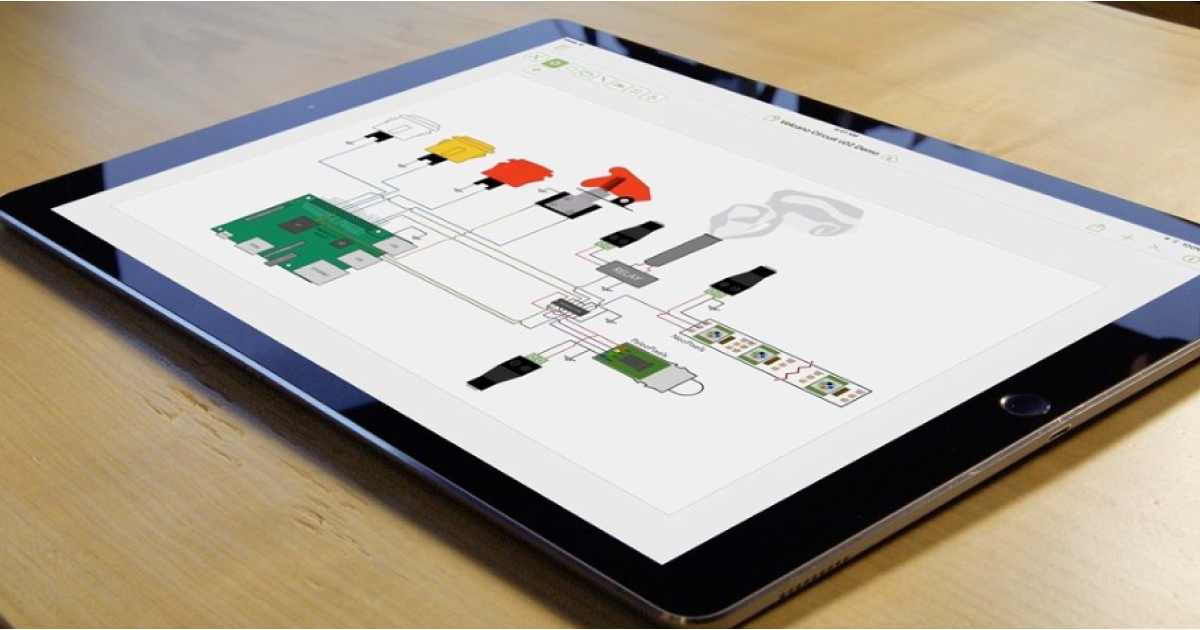
Looking for the best iPad flowchart apps? Explore the full guide to know the top 8 flowchart apps for iOS and make an informed decision based on your preferences & requirements.
HOW-TO & TIPS
5 Minutes
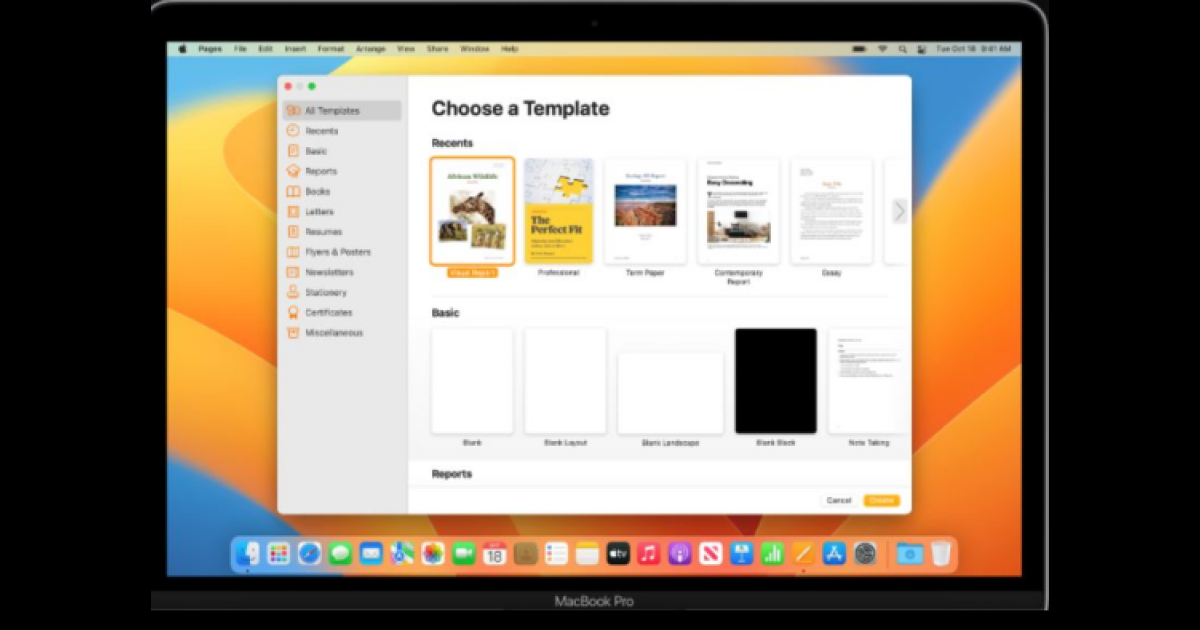
If you're looking for a reliable & efficient tool to make flow charts on your Mac device, then Pages software is all you need to do this.
DISCOVERY
5 Minutes
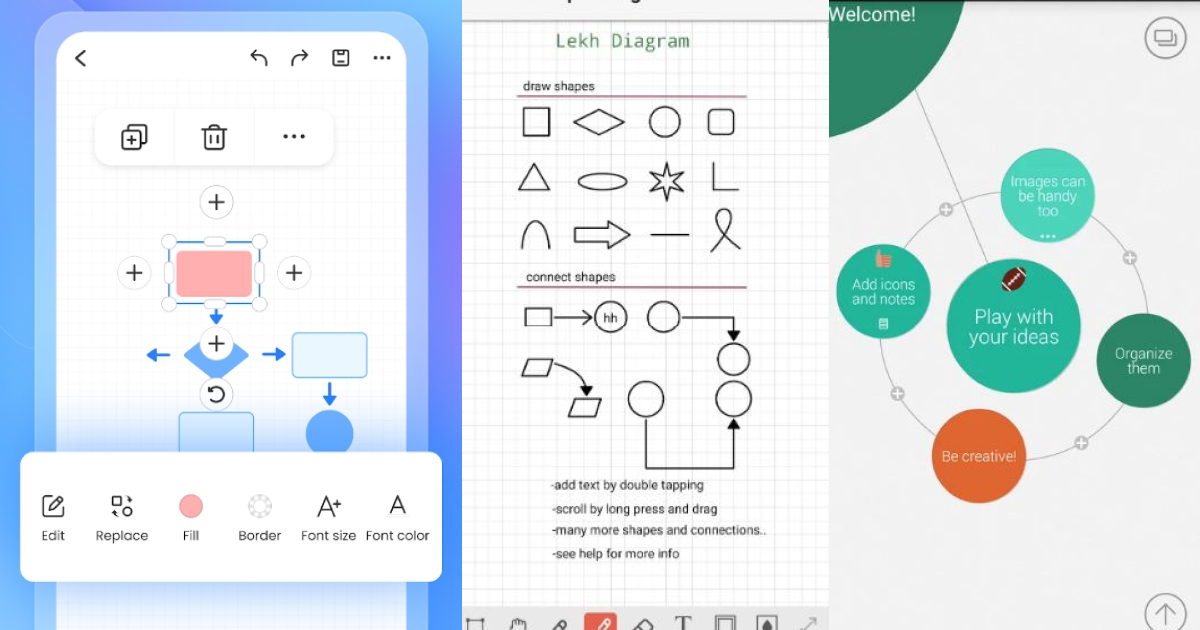
Here we have collected a few best flowchart apps Android offers, which will assist you greatly in designing outstanding flow diagrams whether you are a professional or a student.

DISCOVERY
5 Minutes
Given the need to opt for a highly-rated open-source tool to draw the perfect flowchart, we have performed a detailed comparative analysis of a few top-rated open-source flowchart tools.

HOW-TO & TIPS
5 Minutes
This article highlights significant approaches to designing a well-organized, expressive, and emphatic flowchart, in addition to the detailed procedure for primary flowchart construction.
DISCOVERY
5 Minutes
We have conducted a profound comparative analysis of the top 7 well-bestowing free software to save your budget and efforts.

DISCOVERY
5 Minutes
This article enumerates the 7 best free flowchart online creators to simplify your flowcharting journey, making it expeditious, effective, and effortless.

DISCOVERY
5 Minutes
We have provided some of the top-notch environment day poster templates to choose which one is your destined for this environmental-concerning event.
DISCOVERY
5 Minutes
Given the need to save Earth, the article uncovers the best practices that can be adapted to play your part towards the sustainability of ecology.

DISCOVERY
5 Minutes
This article explores how you can employ Microsoft Teams, a real-time communication software, to create your business organizational structure for managing workflow efficiently and developing an unbroken reporting structure.

DISCOVERY
5 Minutes
If you're commencing a sole proprietorship enterprise, a sole proprietorship organizational chart will assist you in better management of tasks and accountability of your personnel.
DISCOVERY
5 Minutes
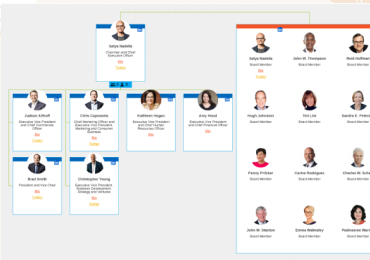
Read this article to understand the hierarchy of Microsoft. It also presents the Microsoft org chart to show formal relationships within the organization.
HOW-TO & TIPS
5 Minutes
Are you looking for different ways to make a Microsoft Office 365 organization chart? Don’t miss this read. It also presents a credible 3rd party tool for org chart creation.

DISCOVERY
5 Minutes
We have profoundly described the partnership organizational chart, its examples, benefits, drawbacks, and tips for its rightful implementation to elevate your partnership business.

DISCOVERY
5 Minutes
Whether you’re owning a renowned coffee shop or just have taken charge as a new manager, having an adaptable organizational structure will help you outshine in the crowded market.
DISCOVERY
5 Minutes
Don’t you know what the repetition flowchart is? Read this guide to understand this idea with repetition flowchart examples. It also presents a credible tool for drawing flowcharts.
DISCOVERY
5 Minutes
You must know even the slightest details of looping in flowcharts if you want to employ them in programming flowcharts for repetitive operations.
DISCOVERY
5 Minutes
Acquiring a proper knowledge of flowchart symbols provide you with an insight into their accurate usage, as in the case of flowchart connectors.
HOW-TO & TIPS
5 Minutes
To make the do-while concept clearer, here we have demonstrated how you can simplify your flow diagrams by implementing do-while loops.

EXAMPLES & TEMPLATES
5 Minutes
Explore the full guide if you are still unaware of how you can make this Easter super-special with these amazing custom-built Easter printables.

EXAMPLES & TEMPLATES
5 Minutes
We have curated some of the top-notch, innovative, and fabulous Easter flyer templates which you can employ to craft a flawless Easter flyer for this upcoming Easter.
DISCOVERY
5 Minutes
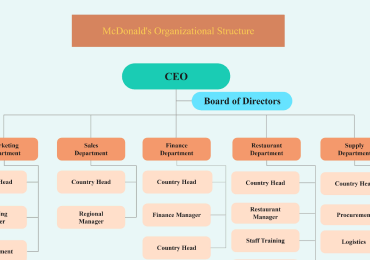
McDonald's org chart can be created straightforwardly if you know its organizational structure. In this context, here you can find a detailed approach to formulating a compelling McDonald's organizational chart.
DISCOVERY
5 Minutes
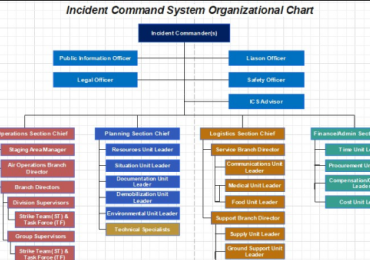
The ICS organizational charts are aimed at facilitating rational incident management by integrating various resources, including staff, resources, and procedures.
DISCOVERY
5 Minutes
LucidChart vs. EdrawMax? Which one to use? Well, both are top-rated tools for creating org charts. Read more to know how to create a Lucid org chart and use EdrawMax for this task.
HOW-TO & TIPS
5 Minutes
Is creating an org chart JS possible? Yes, you can create an organizational chart with JavaScript. The libraries and plugins to use are presented in this guide. Read more.

HOW-TO & TIPS
5 Minutes
Are you one of those business professionals who consume a massive amount of time developing your business policies? Discover the amazing benefits of utilizing ChatGPT for effective marketing strategies.

DISCOVERY
5 Minutes
An effective chain of command within an organizational structure is critical to ensure successful operation and efficiency. Learn how to create one with this guide!

DISCOVERY
5 Minutes
Do you want to understand the Apple organizational structure? Want to explore how precisely this company works? This is the read you don’t want to miss. Read more.
HOW-TO & TIPS
5 Minutes
ChatGPT is a highly effective & popular AI tool for business success, as various other AI applications for small & corporate businesses to drive maximum growth.
HOW-TO & TIPS
5 Minutes
Here you can find out everything you might be interested in about how ChatGPT can be used to maximize students' learning potential and the best ChatGPT examples.

HOW-TO & TIPS
5 Minutes
Discover how ChatGPT can assist teachers in generating lesson plans through a range of practical examples. Save time and enhance your creativity in the classroom today!
DISCOVERY
5 Minutes
We have profoundly illustrated the HR department's functions, various HR structure examples, different models for its structuring, and detailed steps to construct your HR organizational structure.
HOW-TO & TIPS
5 Minutes
The focus of this article will be highlighting ChatGPT, its benefits & uses in the company's HR management, challenges to implementing it, and a few valuable tips for incorporating AI-inspired Chatbot into your system.
HOW-TO & TIPS
5 Minutes
Learn how to create a work breakdown structure in Excel and Edraw Max with the help of this step-by-step guide. The screenshots show how to create a work breakdown structure in Excel.
HOW-TO & TIPS
5 Minutes
Learn how to create a radar chart in Excel with our online step-by-step guide. With this tutorial, you can easily create a spider chart in Excel and Edraw Max Online!
HOW-TO & TIPS
5 Minutes
Our step-by-step guide teaches you how to make a decision tree in PowerPoint and Edraw Max quickly and efficiently! Please read it and learn how to make a decision tree!
HOW-TO & TIPS
5 Minutes
Learn how to create a decision tree in Excel and Edraw Max Online for free with this tutorial! The screenshots of how to create a decision tree are also attached.
HOW-TO & TIPS
5 Minutes
Learn how to create an area chart for free in Excel and Edraw Max with our free online step-by-step tutorial that also contains screenshots.
HOW-TO & TIPS
5 Minutes
Learn how to create a storyboard in PowerPoint using this step-by-step guide. This tutorial will teach you how to make a storyboard in PowerPoint and EdrawMax Online.
HOW-TO & TIPS
5 Minutes
With our step-by-step guide, learn how to make a poster in PowerPoint and EdrawMax Online! This tutorial teaches you how to make a poster in PowerPoint without any hassle.
HOW-TO & TIPS
5 Minutes
Follow our step-by-step guide to learn how to make a Line Graph on Google Docs. You can also know how to make a Line graph on EdrawMax Online with free templates!
HOW-TO & TIPS
5 Minutes
With our step-by-step guide on how to make a line graph in Google Sheets, you can make a customized line graph in Google Sheets!
HOW-TO & TIPS
5 Minutes
Follow this tutorial to learn how to make a line graph in PowerPoint. You can also know how to make a line graph online with free templates quickly!
HOW-TO & TIPS
5 Minutes
Learn how to make a line graph in Word by using our tutorial. This step-by-step guide shows you how to make a customized line graph on Word.
HOW-TO & TIPS
5 Minutes
Learn how to make a comparison chart in MS Excel with our how-to guide! Moreover, it shows you how to make a comparison chart in EdrawMax Online, which is free to use for its essential features.
HOW-TO & TIPS
5 Minutes
Do you want to make a leaflet on Word? With this tutorial, you can quickly learn how to make a leaflet on Word. Alternatively, you can also learn how to make a leaflet on EdrawMax Online.
HOW-TO & TIPS
5 Minutes
This step-by-step guide will teach you how to make a pamphlet on Word. Alternatively, learn how to make a pamphlet on EdrawMax Online! Sign up for free and start building your pamphlet!
HOW-TO & TIPS
5 Minutes
In this guide, we show you a detailed tutorial on how to make a pamphlet on Google Docs. Follow the tutorial to make a pamphlet of your choice on Google Docs!
HOW-TO & TIPS
5 Minutes
Are you looking for an easy way to make a brochure? This step-by-step guide will teach you how to make a brochure on PowerPoint without any hassle.
HOW-TO & TIPS
5 Minutes
Follow the steps to learn how to make a brochure on Google Docs and customize it to your liking. Alternatively, know how to make a brochure on EdrawMax Online.
HOW-TO & TIPS
5 Minutes
If you want to make an infographic in Microsoft Word, this guide can help you design infographics from scratch easily and quickly.
HOW-TO & TIPS
5 Minutes
This article will show you how to make a scatter plot in Google Sheets with a step-by-step guide. Use a scatter plot to find how one variable is affected by another one.
HOW-TO & TIPS
5 Minutes
This tutorial will show you how to make a brochure on Microsoft Word from scratch and use a Word brochure template.
HOW-TO & TIPS
5 Minutes
Follow this tutorial and learn how to make a Venn diagram in MS Word. See more Venn templates and find a quicker way to create Venn diagrams using Edraw Max.
HOW-TO & TIPS
5 Minutes
Follow this tutorial to make a Venn diagram in PowerPoint. We’ll show you how to quickly create it with EdrawMax Online and abundant Venn diagram templates.
HOW-TO & TIPS
5 Minutes
Read this article to learn how to make a Venn diagram in Google Slides in minutes. It will be very easy using Venn diagram templates with step-by-step instructions.
HOW-TO & TIPS
5 Minutes
Want to make a Venn diagram in Google Sheets? Read this article, follow step-by-step instructions and find a faster way to create Venn diagrams in minutes.
HOW-TO & TIPS
5 Minutes
Need to make a Venn diagram in Google Docs? Follow this tutorial, we will give you a complete guide and a faster way to create Venn diagrams in minutes.
HOW-TO & TIPS
5 Minutes
Learn how to make a Venn diagram in Excel and EdrawMax Online makes it easier with abundant Venn templates and powerful drawing tools.
HOW-TO & TIPS
5 Minutes
Go through this article to learn how to make a pie chart in Word and find out how to change its chart style and format.
HOW-TO & TIPS
5 Minutes
Follow these steps to make a pie chart diagram in PowerPoint when you want to visualize data and percentage in a presentation.
HOW-TO & TIPS
5 Minutes
Find out how to create a Pie chart in Google Sheets so people can access it in the cloud. Learn how to make a Pie chart with templates in Edraw Max.
HOW-TO & TIPS
5 Minutes
It's easy to create a mind map in Word. Go through this guide and learn how to make a mind map in Word with built-in SmartArt graphics.
HOW-TO & TIPS
5 Minutes
Read this tutorial and know how to make a mind map in PowerPoint. Learn how to efficiently create mind maps using PowerPoint and EdrawMax Online.
HOW-TO & TIPS
5 Minutes
Use MS Excel to make your mind maps for different purposes. Follow the instructions in this article and find an efficient way to create mind maps.
HOW-TO & TIPS
5 Minutes
Learn how to make and present a Gantt chart in Google Slides and Edraw Max. The result: Edraw Max preforms more efficiently and productively.
HOW-TO & TIPS
5 Minutes
Learn how to create a Gantt chart in Google Sheets and we’ll introduce an easier way to make Gantt charts in EdrawMax Online with free templates.
HOW-TO & TIPS
5 Minutes
This tutorial will show you how to make and share a Gantt chart in Goolge Docs and EdrawMax Online. EdrawMax Online provides many free Gantt chart templates.
HOW-TO & TIPS
5 Minutes
Funnel charts are widely used in business and marketing. Read this tutorial and learn how to make a funnel chart in Excel.
HOW-TO & TIPS
5 Minutes
Quickly know how to make a flowchart in Google Slides and learn the other easy way of creating a flowchart in Edraw Max with free template.
HOW-TO & TIPS
5 Minutes
Understand how to make and share a flowchart in Google Sheets and see the procedure of making a flowchart with free templates in Edraw Max.
HOW-TO & TIPS
5 Minutes
Learn how to create and share a flowchart in Google Docs and walk through the process of making a flowchart with free templates in EdrawMax Online.
HOW-TO & TIPS
5 Minutes
Need to know how to make a bubble chart in Excel? Go through this post and a faster way to create beautiful and professional bubble charts.
HOW-TO & TIPS
5 Minutes
Get to know how to make a bar graph in Microsoft Word in just a few steps and you can create a bar chart in Excel or PowerPoint as well.
HOW-TO & TIPS
5 Minutes
Follow this tutorial and learn how to make a bar graph in Google Sheets when you want to visualize data and access it in the cloud.
HOW-TO & TIPS
5 Minutes
Make your org chart in the cloud so people can access it in a pinch. Learn how to create an organizational chart in Google Slides and Edraw Max.
HOW-TO & TIPS
5 Minutes
Make your org chart in the cloud so people can access it in a pinch. Learn how to create an org chart in Google Sheets and EdrawMax Online.
HOW-TO & TIPS
5 Minutes
Make your org chart in the cloud so people can access it in a pinch. Learn how to create an org chart in Google Docs and EdrawMax Online.
HOW-TO & TIPS
5 Minutes
Go through this article and learn how to make a timeline in Google Slides. EdrawMax Online can help you create timelines with free templates more efficiently.
HOW-TO & TIPS
5 Minutes
Go through this article and learn how to make a timeline in Google Sheets. EdrawMax Online can help you create timelines with free templates more efficiently.
HOW-TO & TIPS
5 Minutes
This article will show you how to make a timeline in Google Docs. EdrawMax Online can help you create timelines with free templates more efficiently.
HOW-TO & TIPS
5 Minutes
Read this article and learn how to create a timeline in Word. EdrawMax Online can help you make different timelines with free timeline templates and examples.
HOW-TO & TIPS
5 Minutes
Read this article and learn how to create a timeline in PowerPoint. EdrawMax Online can help you make different timelines with free timeline templates and examples.
HOW-TO & TIPS
5 Minutes
Read this article to find out how to make a timeline in Microsoft Project. EdrawMax Online can help you create timelines with free templates more efficiently.
HOW-TO & TIPS
5 Minutes
Look through this tutorial of creating a timeline in Excel. EdrawMax Online can help you make various timelines with free timeline templates and examples.
HOW-TO & TIPS
5 Minutes
Read this article to find out how to make a Gantt chart in Microsoft Project. EdrawMax Online can help you create Gantt Charts with free templates and professional tools.
HOW-TO & TIPS
5 Minutes
Go through this article and learn how to make a doughnut chart in Excel. EdrawMax Online with its free doughnut chart examples helps you work more efficiently.
HOW-TO & TIPS
5 Minutes
Go through this tutorial to find out how to make a pie chart in Excel. EdrawMax Online with its free pie chart examples helps you work more efficiently.
HOW-TO & TIPS
5 Minutes
Read this tutorial to know how to make a scatter plot in Excel. EdrawMax Online can help you make scatter plot efficiently with free chart templates and powerful drawing tools.
HOW-TO & TIPS
5 Minutes
Read this article to know how to make a line graph in Excel. EdrawMax Online can help you make line graphs efficiently with free graph templates.
HOW-TO & TIPS
5 Minutes
Go through this article to know how to make a bar graph in Excel. Graph maker EdrawMax Online can make it easier and faster with free graph templates.
HOW-TO & TIPS
5 Minutes
Go through this article to know how to make a graph or chart in Excel. Graph maker EdrawMax Online can make it easier with abundant free chart templates.
HOW-TO & TIPS
5 Minutes
Read this article and learn how to make a SWOT analysis diagram in PowerPoint. EdrawMax Online can help you make a SWOT matrix quickly with free templates.
HOW-TO & TIPS
5 Minutes
Read this tutorial and know how to make an infographic in PowerPoint. Work with EdrawMax Online and there are abundant free infographic templates for you.
HOW-TO & TIPS
5 Minutes
Read this tutorial to make out the differences between Bar Graph and Histogram and know how to make a histogram in Excel through 3 ways.
HOW-TO & TIPS
5 Minutes
Want to know about how to make a Gantt chart in PowerPoint? Read this tutorial and EdrawMax Online will give you a quicker solution to making Gantt charts with free templates.
HOW-TO & TIPS
5 Minutes
Want to know about how to make a Gantt chart in Word? Read this tutorial and EdrawMax Online will give you a quicker solution to making Gantt charts with free templates.
HOW-TO & TIPS
5 Minutes
Want to know about how to make a Gantt chart in Excel? Read this tutorial and EdrawMax Online will give you a better solution to making Gantt charts with free templates.
HOW-TO & TIPS
5 Minutes
Read this article to know what is a data flow diagram and how to create it in PowerPoint. EdrawMax Online helps you make excellent dfds with free templates.
HOW-TO & TIPS
5 Minutes
Read this article to know what is a data flow diagram and how to create it in Word. EdrawMax Online helps you make excellent DFDs with free templates.
HOW-TO & TIPS
5 Minutes
Read this article to know what is a data flow diagram and how to create it in Excel. EdrawMax Online helps you make excellent dfds with free templates.
HOW-TO & TIPS
5 Minutes
Read this article to know how to create a fishbone diagram in PowerPoint. EdrawMax Online helps you make fast and impressive fishbone diagrams with free templates.
HOW-TO & TIPS
5 Minutes
Read this article to know how to create a fishbone diagram in Word. EdrawMax Online helps you make fast and impressive fishbone diagrams with free templates.
HOW-TO & TIPS
5 Minutes
Get to know how to create a fishbone diagram in Excel. EdrawMax Online helps you make fast and impressive fishbone diagrams with free templates.
HOW-TO & TIPS
5 Minutes
This article will show you how to create a flowchart in PowerPoint. EdrawMax Online can help you create high-quality flowcharts more efficiently than using PowerPoint.
HOW-TO & TIPS
5 Minutes
This tutorial will tell you how to create a flowchart in Word. EdrawMax Online can help you create high-quality flowcharts with less effort than using Word.
HOW-TO & TIPS
5 Minutes
Read this article to know how to create a flowchart in Excel. EdrawMax Online can help you create high-quality flowcharts but spend less time than Excel.
HOW-TO & TIPS
5 Minutes
Emergency evacuation plans are pivotal for getting building compliance. Learn how to make an evacuation plan or fire escape plan using EdrawMax Online.
HOW-TO & TIPS
5 Minutes
Maximise space in your dream home by taking the aid of EdrawMax Online - a popular software, renowned for creating modern house designs.
HOW-TO & TIPS
5 Minutes
A dream garden starts with a great design! Start making your garden design with EdrawMax Online and save money on professional help.
HOW-TO & TIPS
5 Minutes
Free Network Diagram Tutorial - learn how to draw a network diagram with the help of free online network diagram templates in EdrawMax Online.
HOW-TO & TIPS
5 Minutes
How to Make a Decision Tree - Follow this guide and learn how to make a decision tree to visualize decisions with the help of EdrawMax Online free templates and symbols.
HOW-TO & TIPS
5 Minutes
Learn how to make a poster design at home with the help of EdrawMax Online free poster templates and symbols in just a few steps.
HOW-TO & TIPS
5 Minutes
Read this guide on how to read and understand Piping and Instrumentation Drawings (P&IDs). P&ID drawings, Process and Instrumentation Diagrams, or Process and Control Diagrams.
HOW-TO & TIPS
5 Minutes
Learn how to make an ER Diagram online using free ER diagram templates and tools. This ER Diagram tutorial gives you all that you need to create an ER Diagram from scratch.
HOW-TO & TIPS
5 Minutes
Read this UML (Unified Modeling Language) diagram tutorial and learn how to draw a UML diagram online using EdrawMax Online with free templates.
HOW-TO & TIPS
5 Minutes
If you want to make a banner, you've come to the right place! Learn how to make a banner online with free banner templates and formatting tools from EdrawMax Online.
HOW-TO & TIPS
5 Minutes
Learn how to make a stunning travel brochure online using free online holiday brochures templates and tools from EdrawMax Online.
HOW-TO & TIPS
5 Minutes
Learn how to make a storyboard using EdrawMax Online with free templates. With our step-by-step tutorial, you can easily learn how to make a storyboard online!
HOW-TO & TIPS
5 Minutes
Follow the steps discussed in this article to conduct a personalized SWOT analysis right now. Conducting a SWOT analysis is useful in decision-making, and doing it well can have longterm positive effe
HOW-TO & TIPS
5 Minutes
This detailed guide will set in the right path when you decide to conduct/do a PEST analysis. Run a PESTLE analysis and investigate external factors that can crop up and impede the success of your org
HOW-TO & TIPS
5 Minutes
Creating an infographic online doesn’t have to be a tedious and difficult task. Follow this detailed guide to plan and make your infographic with beginner-friendly EdrawMax Online.
HOW-TO & TIPS
5 Minutes
This detailed guide will help you to make a genogram online. It takes time first, but once you know the principles, it will be an easy task.
HOW-TO & TIPS
5 Minutes
This article has highlighted the steps on how to make a pamphlet in minutes with easy to use tools and a wide range of professionally designed templates.
HOW-TO & TIPS
5 Minutes
Want to know how to make a newsletter online? Read this article to learn the easiest way of how to create a newsletter and everything related to this issue.
HOW-TO & TIPS
5 Minutes
Here is the complete guide and helps you learn how to create an eye-catching leaflet! Design a creative and compelling leaflet with EdrawMax Online.
HOW-TO & TIPS
5 Minutes
Follow the detailed guide in this article and create memorable and effective flyers online. With EdrawMax Online, all you need is your imagination.
HOW-TO & TIPS
5 Minutes
This tutorial shows how to create a scatter plot or scatter chat online by using scatter plot templates in which you can edit the data and set of the variables to conclude available correlations.
HOW-TO & TIPS
5 Minutes
Make your graphic organizer design for free with EdrawMax Online. You can complete a graphic organizer in just 5 simple steps with free and editable templates.
HOW-TO & TIPS
5 Minutes
Refer EdrawMax Online to know more about how to make a concept map online. Free templates of concept map and useful for business, marketing and educational purpose.
HOW-TO & TIPS
5 Minutes
How to make a brochure? Choose a brochure template from EdrawMax Online and it's easy to create a brochure with EdrawMax Online, even if you are new at designing brochures.
HOW-TO & TIPS
5 Minutes
If you are looking for an easy way to draw Venn Diagrams for your studies or office needs, this article has exactly the kind of information you need.
HOW-TO & TIPS
5 Minutes
This article explains what a timeline is, why is it used, and how you can make a timeline online with least efforts using EdrawMax Online.
HOW-TO & TIPS
5 Minutes
This article explains what line graphs are and how you can make them online in a few simple steps using EdrawMax Online.
HOW-TO & TIPS
5 Minutes
If you want to make a fishbone diagram easily and quickly, this article explains the process to do so with merely a few mouse clicks.
HOW-TO & TIPS
5 Minutes
This article explains how you can draw science diagrams easily and quickly using EdrawMax Online. As a science scholar or trainer, you would definitely need several diagrams to illustrate various obj
HOW-TO & TIPS
5 Minutes
Read this article to find out how to make a bar graph online easily and quickly. EdrawMax Online can help you in customizing your data in the form of charts which you can download as well.
HOW-TO & TIPS
5 Minutes
Follow this tutorial and learn how to quickly make a pie chart online instead of in Excel. It also tells you how to customize your pie chart for better visualization.
HOW-TO & TIPS
5 Minutes
Organizational charts are useful in visually presenting organization structures. Follow this guide and learn how to make an org chart online.
HOW-TO & TIPS
5 Minutes
Learn how to create and build mind maps online. Using mind maps rightly will help you work efficiently, generate new ideas and think logically.
HOW-TO & TIPS
5 Minutes
Go through this step-by-step tutorial to learn how to make a Gantt chart online with screenshots. Include free editable and downloadable Gantt chart templates.
HOW-TO & TIPS
5 Minutes
Read this article to find out how to make a flowchart online easily and quickly. EdrawMax Online can help you create flowcharts with free templates and professional tools.
DISCOVERY
5 Minutes
In case you need to answer the question ‘what is a context diagram?’ and need a tutorial on how to make a system context diagram, read this article.
DISCOVERY
5 Minutes
A Scatter Plot is very useful to understand the behavior of two variables and interpret the trend; you can learn everything about it in this tutorial.
DISCOVERY
5 Minutes
Get to know the incredible technique of mind map that helps many organizations as well as individuals to organize their ideas better.
DISCOVERY
5 Minutes
A concept map is a brilliant way to represent concepts, ideas, and the relations between them visually; learn everything about concept maps from this excellent guide.
DISCOVERY
5 Minutes
The article will teach you what industrial control systems are, their applications, and their diagrams with the best online diagramming tool.
DISCOVERY
5 Minutes
Area chart is a very simplistic approach to visualize changes in data over time. Learn all about stacked area charts from this tutorial.
DISCOVERY
5 Minutes
This tutorial will answer what is a Reflected Ceiling Plan, its examples, components, and everything you need to know it.
DISCOVERY
5 Minutes
Understanding what macro-forces influence your business is what we use a PESTEL analysis for, so read the above article to know what is pestle.
DISCOVERY
5 Minutes
We have all used a column chart throughout our academic years at least once. In this guide to what is column chart, you will learn all you need to know about them.
DISCOVERY
5 Minutes
Get to know what is a T Chart and learn about this visual tool with T Chart examples. The post has also included a solution to create T Chart Graphic Organizers.
DISCOVERY
5 Minutes
Get to know what is a Radar Chart or a Spider Chart in this post. Apart from Radar Graph examples, it also includes a tutorial to draw stunning Spider Graphs.
DISCOVERY
5 Minutes
Do you wish to create an interesting gauge chart, but don’t know how to start? Read this extensive post and get your queries resolved about dial charts.
DISCOVERY
5 Minutes
Do you wish to draft an informative and visually appealing comparison chart? Read on and get to know essential details about a comparison chart in this post.
DISCOVERY
5 Minutes
Do you want to know what is a Bubble Chart and how to create one? Read on and learn from some Bubble Chart examples and how to draw Bubble Plots on the go.
DISCOVERY
5 Minutes
Discover the concept of Total Quality Management definition, examples, principles, and learn how to draw the one with Edraw Max online.
DISCOVERY
5 Minutes
This article is a detailed guide to what is a donut chart, how to create a donut chart as well as its several advantages and limitations.
DISCOVERY
5 Minutes
Do you know what is Fault Tree Analysis, or the Fault Tree Analysis examples? Well, then you must read this guide on Fault Tree Analysis.
DISCOVERY
5 Minutes
Create an enterprise architecture framework conveniently without anyone’s help. Read the article to know what is enterprise architecture and its creation process.
DISCOVERY
5 Minutes
A line graph depicts the relationship between data groups by connecting individual data points. Line graphs help analyze trends and observe data over continuous time intervals.
DISCOVERY
5 Minutes
With the right software like EdrawMax online, creating a Block Diagram is a walk in the park. Find out what a Block Diagram is and much more from this article.
DISCOVERY
5 Minutes
The article will cover what is a Venn diagram, Venn diagram examples, and way to make Venn diagram online. Keep reading.
DISCOVERY
5 Minutes
Learn about Value Chain Analysis and its benefits in competitive advantages and use online tools to create your value chain model in this tutorial.
DISCOVERY
5 Minutes
Feeling motivated to study and create something meaningful and fun? Find all there is to know about a pyramid chart and Maslow’s hierarchy of needs chart in this article.
DISCOVERY
5 Minutes
Bar charts can represent data in a summarized fashion for easy understanding and comparison. In this Bar Chart tutorial,l you will learn all there is to about Bar charts.
DISCOVERY
5 Minutes
Learn about the wiring diagram and its making procedure with different wiring diagram symbols. The article also contains the purpose and benefits of creating a wiring diagram.
DISCOVERY
5 Minutes
P&ID is necessary for a process plant development. It is an engineering diagram that depicts detailed information about everything related to installing a process plant and helps with the safety and m
DISCOVERY
5 Minutes
Learn all there is about Gantt Chart and their uses & benefits and how to draw a Gantt Chart with Edraw Max online.
DISCOVERY
5 Minutes
Studying a circuit diagram and creating one is an enjoyable activity. It is suitable for both kids and adults as it enlightens them on how electricity works.
DISCOVERY
5 Minutes
Are you looking to create an office floor plan? Then read the guide above to know all about the office layout.
DISCOVERY
5 Minutes
Work Breakdown Structure is an essential element for the systematic flow of a project without missing any checkpoints. Know more about WBS here!
DISCOVERY
5 Minutes
Get to know what a network diagram is and create one effortlessly with Edraw Max. Learn the importance, types, and network diagram examples here
DISCOVERY
5 Minutes
Create a fishbone diagram with Edraw Max to perform a cause and effect analysis effectively. Read this guide to find the root causes of your problem.
DISCOVERY
5 Minutes
Learn about a lean tool - value stream mapping (VSM) from various aspects including the importance, benefits, examples, and process in detail.
DISCOVERY
5 Minutes
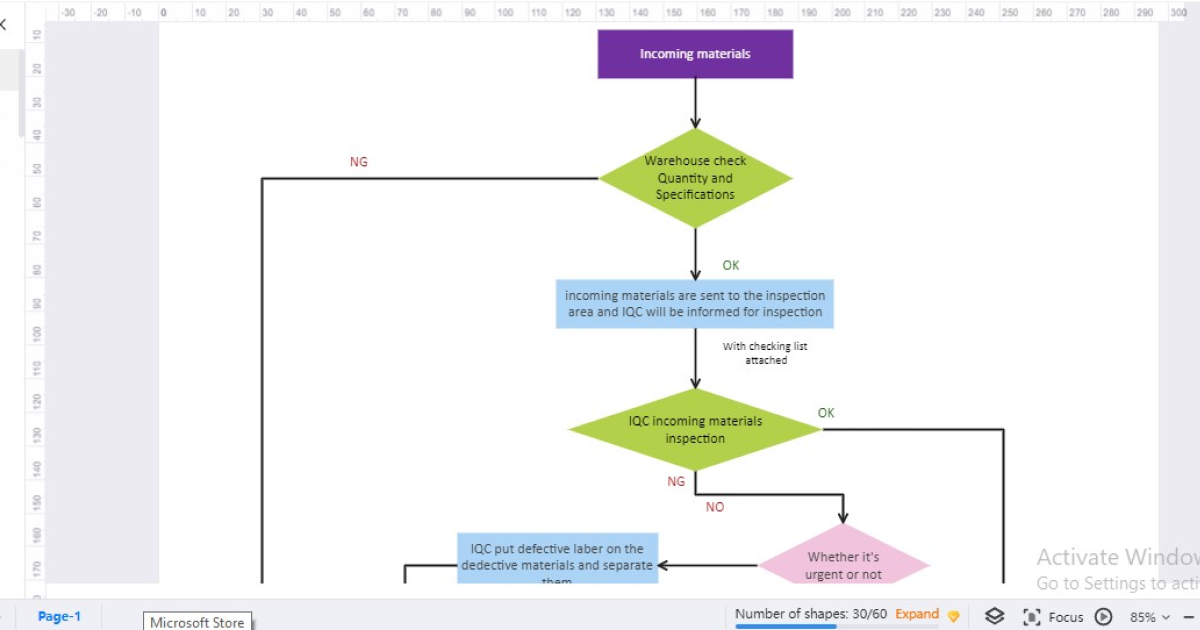
A process flowchart is a visual representation of the business process. Learn to create a process flowchart to tackle any problem that may arise.
DISCOVERY
5 Minutes
Get to know the importance of brochures before creating an eye-catching brochure. Get started quickly with a template and create your own brochure!
DISCOVERY
5 Minutes
Get to know what a timeline is and the types of the timeline. Learn from the various timeline examples to visualize the event. Get started now! It's Free.
DISCOVERY
5 Minutes
Learn what is science diagram, the types of it, how to do it, along with examples of biology, physics and chemistry diagrams.
DISCOVERY
5 Minutes
Know about your dearest family's history by mapping out a family tree using the powerful tool - Edraw Max! It provides various examples. Try it free!
DISCOVERY
5 Minutes
A logic gate is a digital switch that gives an output by performing Boolean operations on two given inputs. Every electronic device uses various logic gates as switches in its digital systems. Logic g
DISCOVERY
5 Minutes
Get to know what a wireframe is and its importance. Read this article to learn its different types and create your own wireframe with the help of Edraw!
DISCOVERY
5 Minutes
House wiring diagrams are the visual representation of the electrical circuits all over the house. Here you can find out all you need to get started now.
DISCOVERY
5 Minutes
Get to know what an infographic is and visualize your data with this stunning graph. Use Edraw Max to make your infographics stand out in minutes.
DISCOVERY
5 Minutes
A pie chart is a graphic statistic tool that can show your business growth and comparison with competitors. Create your pie chart with Edraw Max now!
DISCOVERY
5 Minutes
Are you interested in Graphic Organizers and want to know about their types or examples? Read this article and use EdrawMax to create your own!
DISCOVERY
5 Minutes
Quickly know what a decision tree is and how to create one like a pro. Read this article to know the details of the decision tree and easily create your own!
DISCOVERY
5 Minutes
Get to know every essential thing about UML diagrams in this article. It covers details like what is UML, different types of UML diagrams, and more.
DISCOVERY
5 Minutes
Get to know six sigma methodology in this guide. Learn from six sigma examples and create your own 6 sigma diagram with EdrawMax. Try it today!
DISCOVERY
5 Minutes
Get to know what SWOT Analysis is in this guide. It covers details about the key elements of the model, SWOT Analysis examples, how-tos and more.
DISCOVERY
5 Minutes
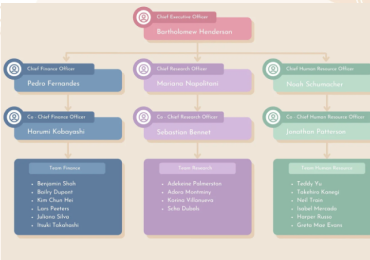
Know every crucial thing about Organizational Charts here. The article has covered details like how-tos, its benefits, limitations, etc. Try it now!
DISCOVERY
5 Minutes
Do you need floor plans to design your office or home? Read this article and learn to make a stunning floor plan easily with EdrawMax. Try it today!
DISCOVERY
5 Minutes
Looking for a quick-to-start guide of flowchart? Read this article to learn the importance of flowchart and easily create a flowchart with EdrawMax.
DISCOVERY
5 Minutes
Empower yourself with the art of storyboarding using Edraw storyboard graphic organizer and lucidly express your story idea. Try it now!
DISCOVERY
5 Minutes
An entity relationship diagram (ERD) is a visual representation of different linked entities together. Let's see how it is used in database management.
DISCOVERY
5 Minutes
If you want to know what a Swimlane Diagram is and how to make one for your business, the sections discussed here cover everything you need to know about the swim lane diagrams.
EXAMPLES & TEMPLATES
5 Minutes
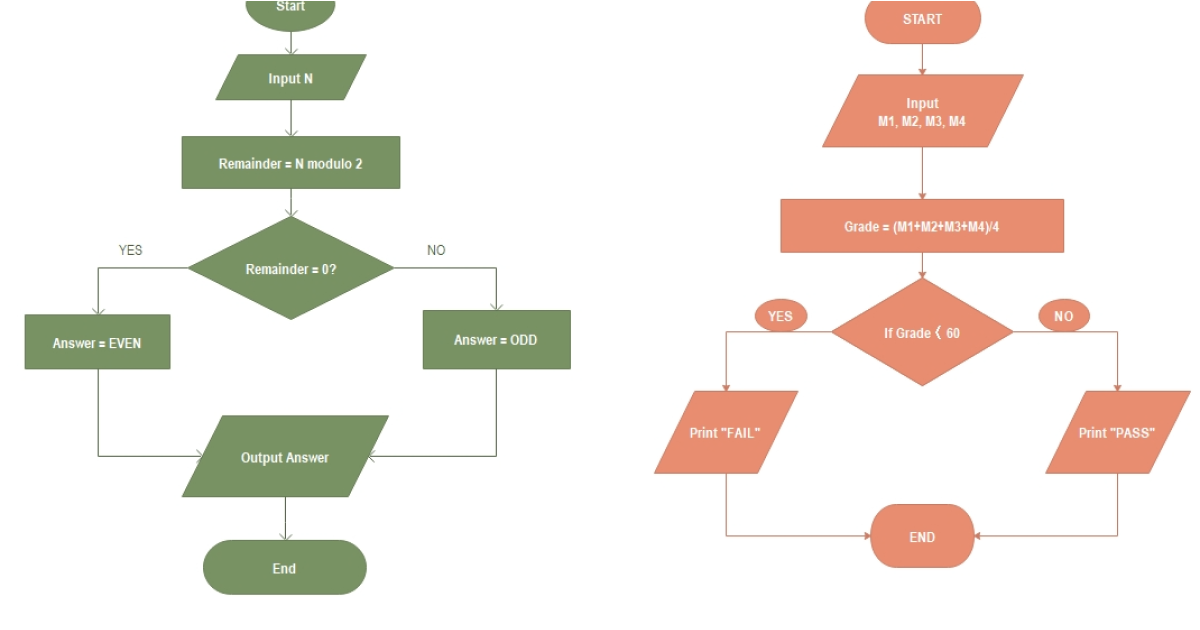
A flowchart precisely is a graphical representation of a procedure or algorithm in the form of a diagram. You can convert a complex process into a bright and straightforward method using a flowchart and make it understandable.
DISCOVERY
5 Minutes
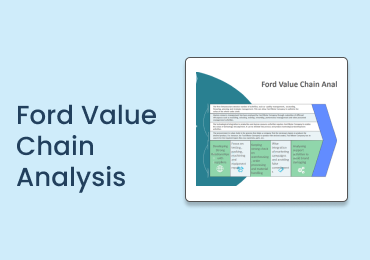
Value Chain Analysis (VCA) helps businesses understand the linkages in their supply chain. In this article we will be discussing Ford value chain analysis and it's implications.
DISCOVERY
5 Minutes
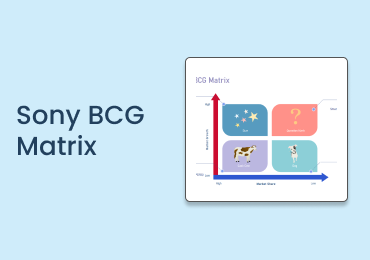
Here we will discuss the BCG matrix of sony, with a solid understanding of their company's market position, from which we can better determine how to best different approach segments.
DISCOVERY
5 Minutes
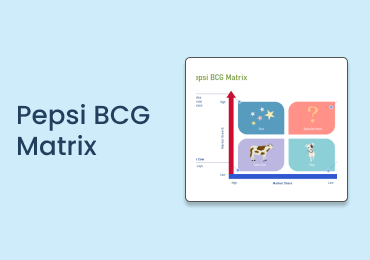
Pepsi Cola has the best product that any brand can have in the category they are in. It is a leader in its category and is number one. In this article, we will discuss the BCG matrix of Pepsi's bevera
DISCOVERY
5 Minutes
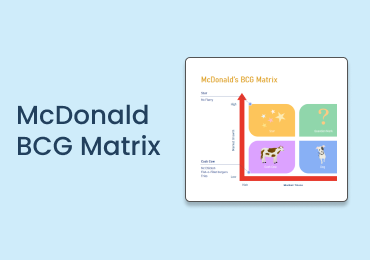
The McDonald's BCG Matrix will help us determine whether a particular promotion is worth the investment.
DISCOVERY
5 Minutes
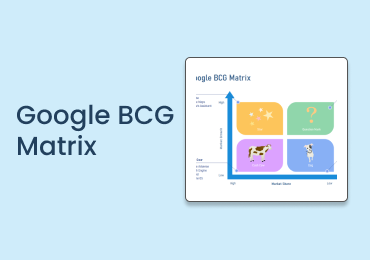
We will use the Google (BCG) Matrix to analyze the revenue-generating Google products. By analyzing the Google products, we can assess the amount of money each of these products generates.
DISCOVERY
5 Minutes
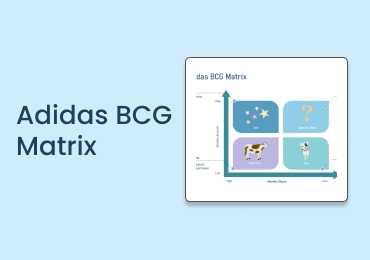
This article will discuss the Adidas BCG Matrix analysis to get an overview of Adidas high and low revenue-generating products.
DISCOVERY
5 Minutes
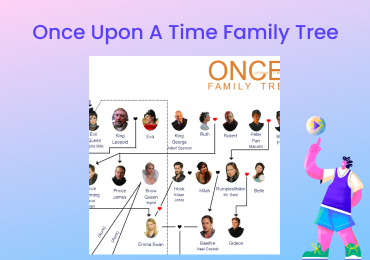
The Once Upon a Time is a Netflix original series about three young women transported into the fairy tale world. This ultimate Once upon a time Family tree will take you to their fantasy world. In add
DISCOVERY
5 Minutes
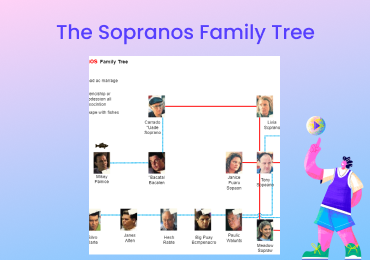
As complicated as the collections of the Sopranos family trees may seem, Edrawmax can help you obsess over your favorite television series characters.
DISCOVERY
5 Minutes
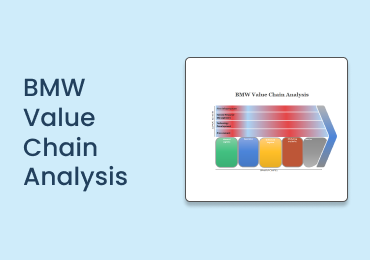
BMW, the German car manufacturing firm, uses a value chain analysis to retain their years of reputation. The BMW value chain analysis is an easy example for other corporations on how to compete and im
DISCOVERY
5 Minutes
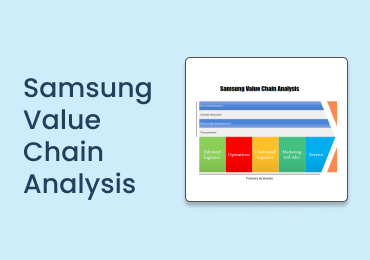
The Samsung value chain analysis is a control assisting structure that helps you improve old strategies and introduce new and perfect innovative methodologies. Generally, it is a visually presentable
DISCOVERY
5 Minutes
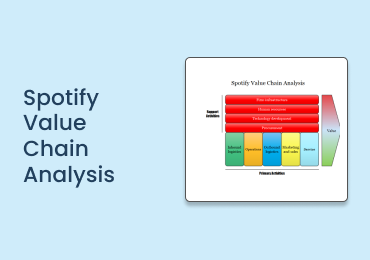
The internal Spotify value chain analysis helps to deal with weaknesses inside its huge dataset. So, it appears ideal for improvement and helps perceive the value chain concept as an example.
DISCOVERY
5 Minutes
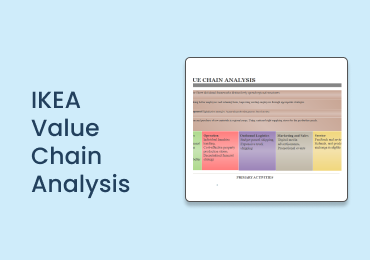
IKEA value chain analysis is not just the name of mere evaluation of general activities. Rather, it focuses on customer satisfaction by improving the procedural creation of goods through user feedback
DISCOVERY
5 Minutes
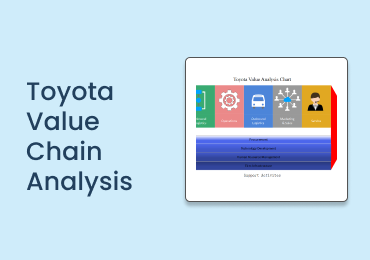
Toyota value chain analysis is an analytical structure that includes every stage, from product creation to after-sale service. It helps to identify the corporation's activities and supply value to the
DISCOVERY
5 Minutes
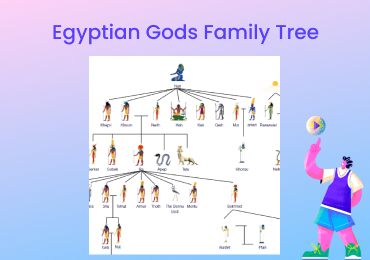
This article is undoubtedly for a history lover looking around for the Egyptian mythology and Egyptian Gods family tree. This article will help people understand how everything in Egyptian mythology.
DISCOVERY
5 Minutes
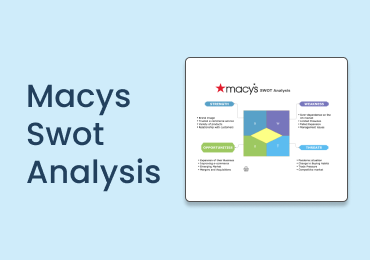
Macy's has a strong market position and a high market share. In this SWOT analysis of Macy's by EdrawMax, we analyze the brand by its strengths, weaknesses, opportunities & threats.
DISCOVERY
5 Minutes
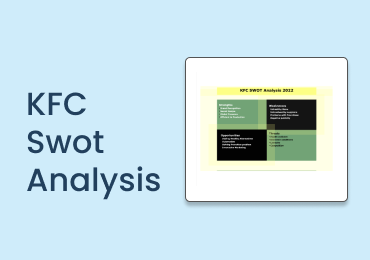
One of the major strengths of KFC is that it has a wide reach in the market. Check out EdrawMax's SWOT analysis of KFC, where we analyze the brand by its strengths, weaknesses, opportunities & threats
DISCOVERY
5 Minutes
Here is EdrawMax's SWOT analysis of Intel which is one of the best technology companies in the world and is world-renowned for its processors.
DISCOVERY
5 Minutes
H&M has constantly been focusing on expanding its store base across the globe. The SWOT Analysis of H&M by EdrawMax manifests the company's current major strengths and opportunities.
DISCOVERY
5 Minutes
This General Motors SWOT analysis 2025 by EdrawMax underlines the company's strengths and weaknesses and suggests probable external opportunities and threats.
DISCOVERY
5 Minutes
SWOT analysis of CVS 2025 by EdrawMax is a strategic planning tool that can be used by CVS Health managers to do a situational analysis of the organization.
DISCOVERY
5 Minutes
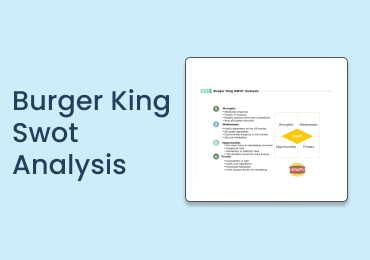
The SWOT analysis of Burger King by EdrawMax analyzes the fast-food giant by strengths, weaknesses, opportunities & threats.
DISCOVERY
5 Minutes
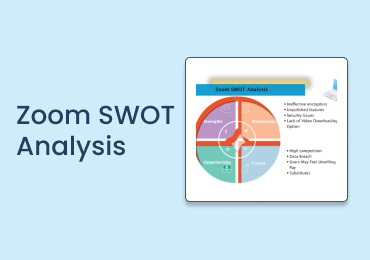
Zoom has been a globally used leading remote tool that offers online meetings. Check out Zoom's SWOT Analysis by EdrawMax.
DISCOVERY
5 Minutes
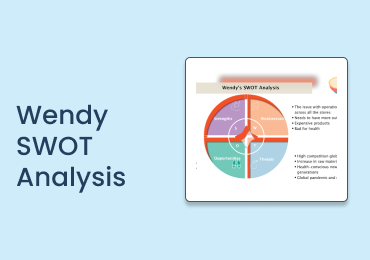
The SWOT analysis of Wendy's by EdrawMax analyzes the fast-food giant by strengths, weaknesses, opportunities & threats.
DISCOVERY
5 Minutes
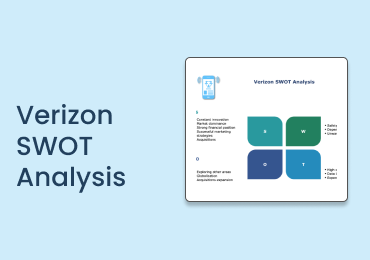
SWOT analysis of Verizon 2025 by EdrawMax is a strategic planning tool that can be used by Verizon Communications Inc. to do a situational analysis of the organization.
DISCOVERY
5 Minutes
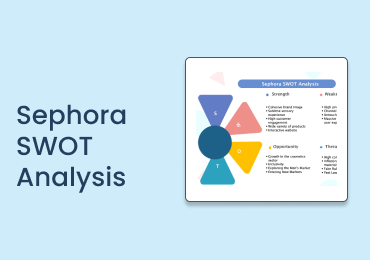
This Sephora SWOT analysis 2025 by EdrawMax underlines the company's strengths and weaknesses and suggests probable external opportunities and threats.
DISCOVERY
5 Minutes
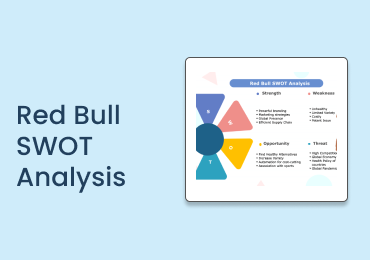
Red Bull has constantly been focusing on expanding its franchise and products across the globe. The SWOT Analysis of Red Bull by EdrawMax manifests the company's current major strengths and opportunit
DISCOVERY
5 Minutes
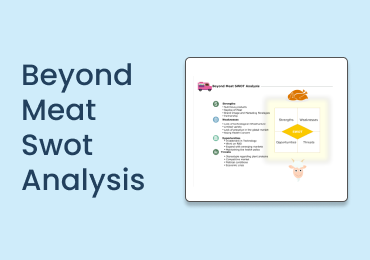
Beyond Meat heavily relies on soy and pea protein. SWOT analysis of Beyond Meat by EdrawMax analyzes the leading food processing brand by strengths, weaknesses, opportunities & threats.
DISCOVERY
5 Minutes
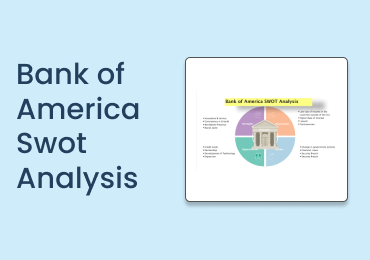
Bank of America has been globally leading with its strong suit of consistent business growth and innovation with services and products. Check out Bank of America's SWOT Analysis by EdrawMax.
DISCOVERY
5 Minutes
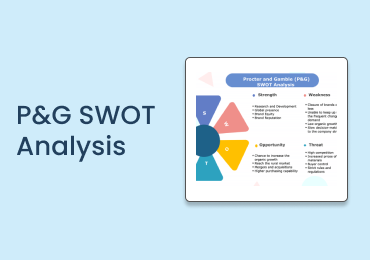
One of the major strengths of Procter and Gamble (P&G) is that it has a wide reach in the market. Check out EdrawMax's SWOT analysis of P&G, where we analyze the brand by its strengths, weaknesses, op
DISCOVERY
5 Minutes
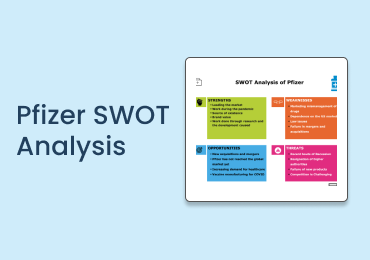
Pfizer has a strong market position and a high market share. In this SWOT analysis of Pfizer by EdrawMax, we analyze the brand by its strengths, weaknesses, opportunities & threats.
DISCOVERY
5 Minutes
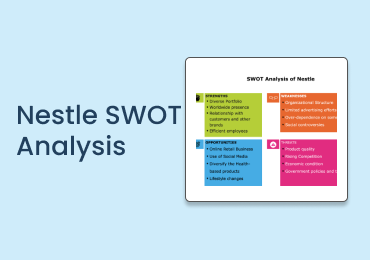
Check out the SWOT Analysis of Nestle by EdrawMax that includes its strengths, shortcomings, opportunities, and dangers in depth.
DISCOVERY
5 Minutes
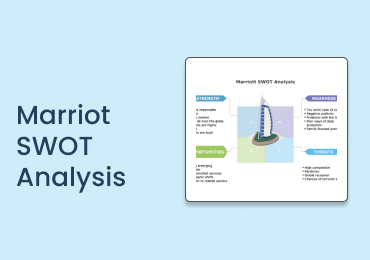
Check out the SWOT Analysis of Marriott by EdrawMax that includes its strengths, shortcomings, opportunities, and dangers in depth.
DISCOVERY
5 Minutes
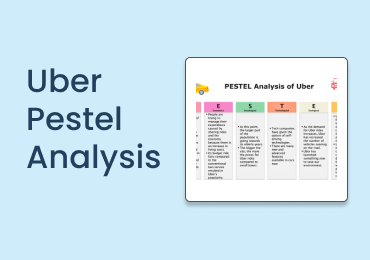
The Uber PESTEL Analysis will give a detailed study of the company based on all the external factors responsible for any decision-making procedure for the company.
DISCOVERY
5 Minutes
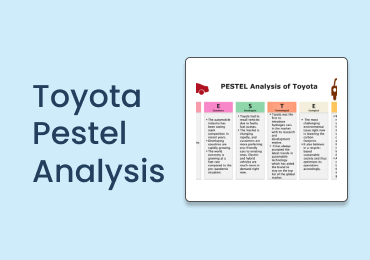
Toyota experiences the effects of social or sociocultural factors. EdrawMax’s PESTEL Analysis will provide a framework for investigating the external environment for Toyota's Global business.
DISCOVERY
5 Minutes
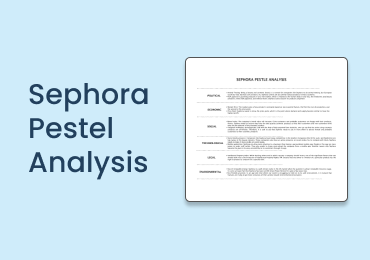
Company professionals can diagnose the six essential external matters affecting Sephora's working and revenue with the help of the Sephora PESTEL Analysis.
DISCOVERY
5 Minutes
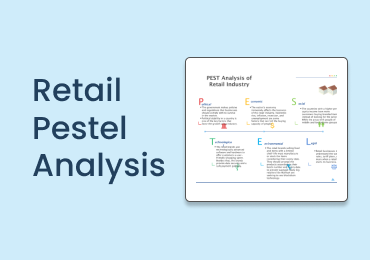
What factors will influence retail strategy in 2025? Check out EdrawMax’s guide to discuss pestle analysis of the retail industry to find out various macro-environmental factors that can impact retail
DISCOVERY
5 Minutes
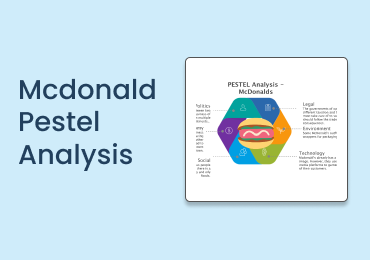
EdrawMax’s PESTLE Analysis of McDonald’s examines the various external factors like political, economic, social, technological (PEST) which impacts this fast food giant.
DISCOVERY
5 Minutes
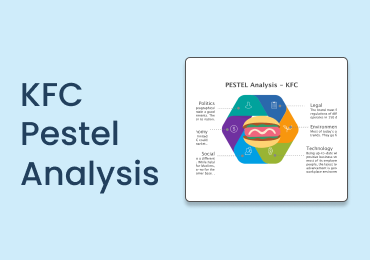
KFC is a well-known brand of fast-food joints with its origin in Kentucky, United States. After Mcdonald's, it is the second largest chain of fast-food restaurants operating in over 150 countries with

DISCOVERY
5 Minutes
In EdrawMax’s PESTLE Analysis of the Hotel Industry, we analyze PESTEL factors to understand the hospitality & hotel industry performance in the external environment.
DISCOVERY
5 Minutes
The PESTEL Analysis of the Fashion Industry works with six significant external factors and helps professionals determine the influence these factors have on a company or industry.
DISCOVERY
5 Minutes
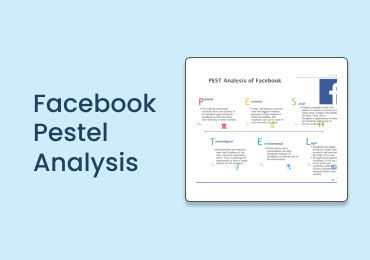
PESTEL Analysis of Facebook is nothing but looking into and then analyzing the six most important external factors that can directly influence the social media giant.
DISCOVERY
5 Minutes
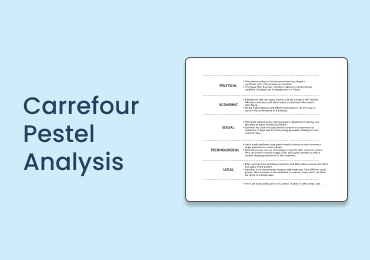
PESTEL Analysis by EdrawMax is a strategic management tool that Carrefour leadership can use to make better decisions.
DISCOVERY
5 Minutes
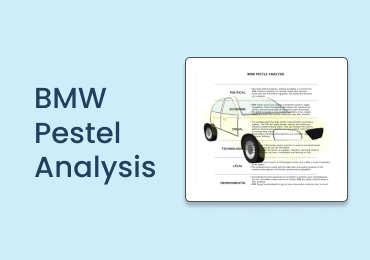
In this PESTLE analysis of BMW by EdrawMax, readers will learn many critical factors that have led to the success of the BMW corporation.
DISCOVERY
5 Minutes
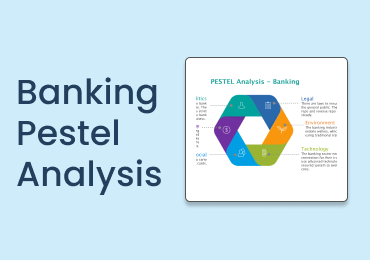
Banking Industry is directly related to the growth of the economy. In EdrawMax’s Pestle Analysis of the banking industry we will find out how political, social, economic, technological & legal factors
DISCOVERY
5 Minutes
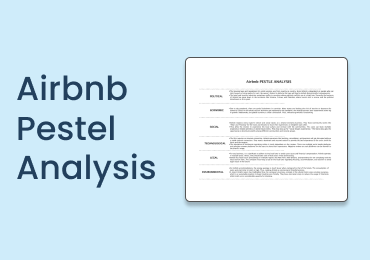
The Airbnb home-sharing model is a suitable choice for hosts, guests and the planet. The PESTLE analysis of Airbnb by EdrawMax examines the political, economic, social, technological, legal and enviro
DISCOVERY
5 Minutes
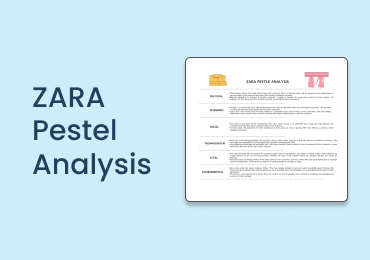
The success of Zara is deeply tied with the economic status of the territories it operates in. This PESTLE analysis of Zara by EdrawMax reviews its market standings through Political, Economic, Socioc
DISCOVERY
5 Minutes
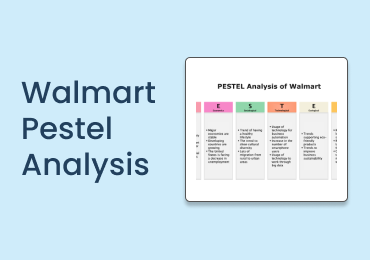
The PESTEL Analysis of Walmart helps diagnose the six major external factors that somehow influence the decisions regarding the firm’s success by the management and the professionals.
EXAMPLES & TEMPLATES
5 Minutes
House of the dragon provides a partial history of the Targaryens, with whom readers will be familiar because their rule dates back to Westeros' first monarch, Daenerys. They are well-known for their a
EXAMPLES & TEMPLATES
5 Minutes
Bank organizational chart example templates are an excellent way to show the structure of a sector, commercial, and government bank. Six editable org templates in the article are free to get, customiz
EXAMPLES & TEMPLATES
5 Minutes
Manufacturing organizational charts are the modern way to categorize the roles and relations between your employees. Only org chart templates can uncover why these diagrams are so helpful for employee
EXAMPLES & TEMPLATES
5 Minutes
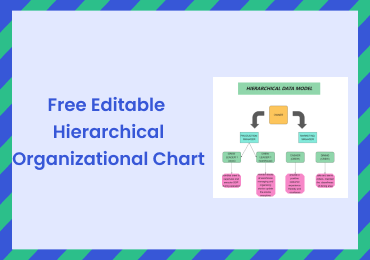
Common hierarchical organizational chart templates help you understand primary structuring concepts, the chain of command, and connections. Plus, these are excellent sources of information for new emp
EXAMPLES & TEMPLATES
5 Minutes
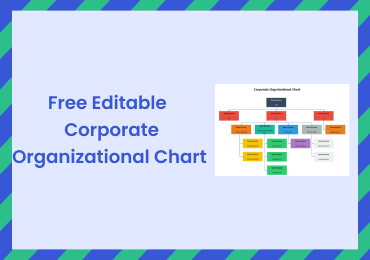
A corporate organizational chart is a simple visualization that targets every element of a corporation to explain its framework. Production of a company organizational chart is easier with free editab
EXAMPLES & TEMPLATES
5 Minutes
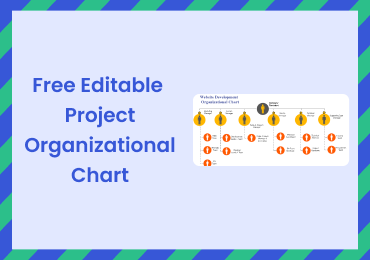
Looking to create a project organizational chart for free? Concerned about your private data? EdrawMax will be your best friend to proceed with. Everything is simple and 100% secure.
DISCOVERY
5 Minutes
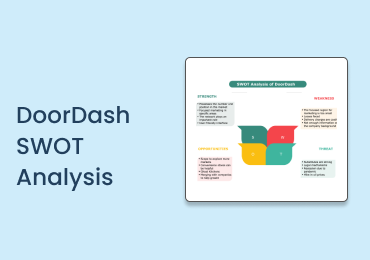
SWOT analysis by EdrawMax is a critical tool for Doordash to determine its strategic competitive position in the market.
DISCOVERY
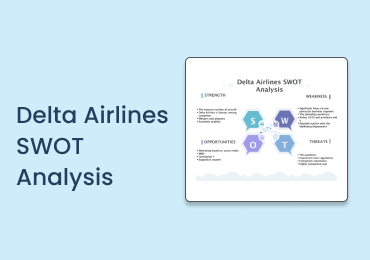
5 Minutes
Delta Airlines owes its continued success to its revenue premium which is around 107%. EdrawMax’s Delta Airlines SWOT analysis examines the Strengths, Weaknesses, Opportunities, and Threats of the air
DISCOVERY
5 Minutes
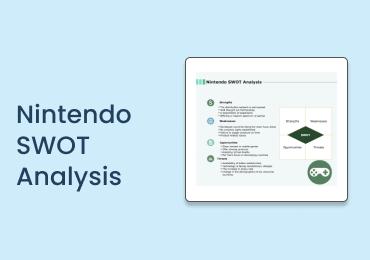
EdrawMax’s Nintendo SWOT analysis will identify the internal and external factors that impact the world's top gaming console manufacturing company's growth.
DISCOVERY
5 Minutes
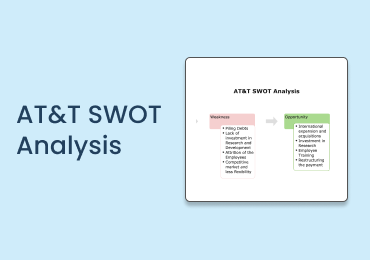
EdrawMax’s AT&T SWOT analysis helps point out the Strengths, Weaknesses, Opportunities, and Threats of the biggest telecom company in the world!
DISCOVERY
5 Minutes
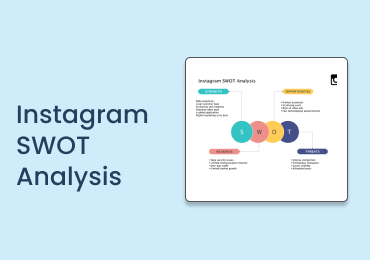
SWOT analysis of Instagram by EdrawMax analyses the brand by its strengths, weaknesses, opportunities & threats.
DISCOVERY
5 Minutes
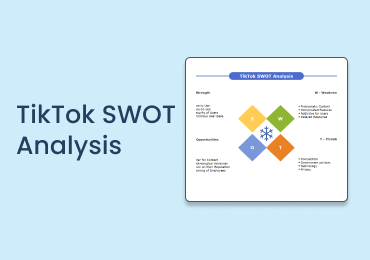
EdrawMax’s Tiktok SWOT analysis highlights the social media app's strengths, weaknesses, opportunities and threats. Check out Tiktok SWOT analysis diagram for better visual learning.
DISCOVERY
5 Minutes
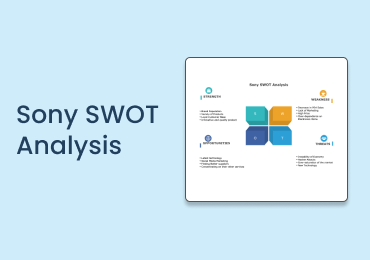
Sony has a powerful brand thanks to its history of creating new, unique, and high-quality products. SWOT analysis of Sony by EdrawMax analyzes the brand by its strengths, weaknesses, opportunities & t
DISCOVERY
5 Minutes
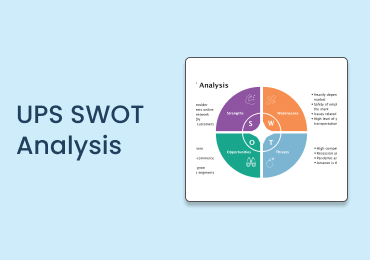
EdrawMax’s UPS SWOT Analysis provides a complete picture of strengths, weaknesses, opportunities, and threats that UPS faces.
DISCOVERY
5 Minutes
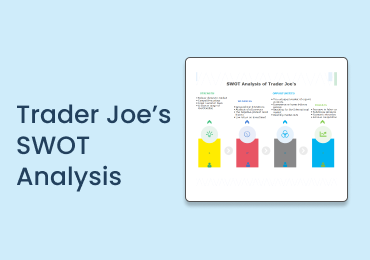
SWOT analysis of Trader Joe's conducted by EdrawMax analyzes the brand/company with its strengths, weaknesses, opportunities & threats.
DISCOVERY
5 Minutes
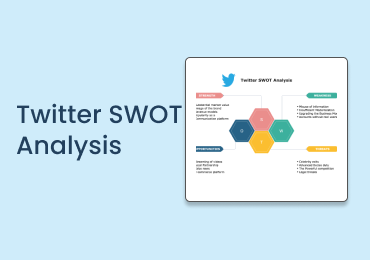
This Twitter SWOT analysis from EdrawMax explores the social media giant's strengths along with its drawbacks, opportunities, and threats.
DISCOVERY
5 Minutes
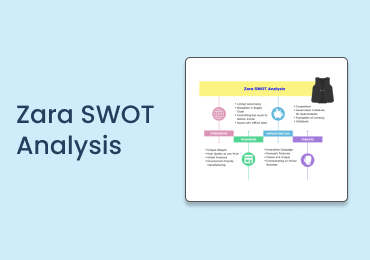
Looking for the SWOT Analysis of Zara? Read the EdrawMax guide to learn about Zara's success, strengths, weaknesses, threats, and more with a diagram.
DISCOVERY
5 Minutes
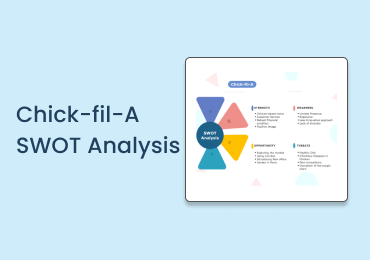
EdrawMax's Chick-fil-A SWOT analysis investigates the Strengths, Weaknesses, Opportunities, and Threats of one of the leading fast-food outlets in the US.
DISCOVERY
5 Minutes
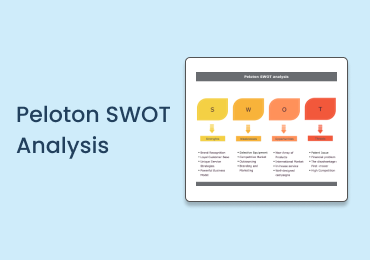
EdrawMax’s Peloton SWOT analysis examines the Strengths, Weaknesses, Opportunities and Threats that the exercise equipment company faces.
DISCOVERY
5 Minutes
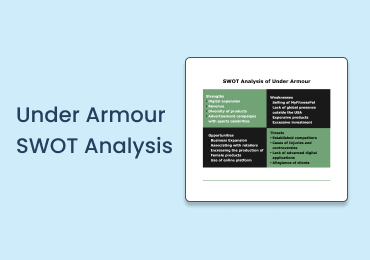
SWOT analysis of Under Armour analyzes the brand by its strengths, weaknesses, opportunities & threats. Check out EdrawMax’s detailed SWOT analysis report.
HOW-TO & TIPS
5 Minutes
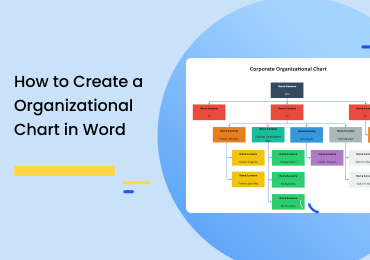
The answer to how to create an organizational chart in Word is crystal clear with the 5-step strategy. However, if you are looking for a more comprehensive and customized chart yet lack time and desig
HOW-TO & TIPS
5 Minutes
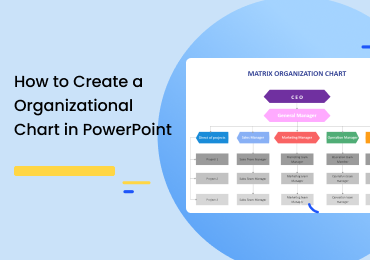
Learning how to create an organizational chart in PowerPoint is easier with our 5-step strategy. You can get your own basic org diagram in a few minutes. However, if you want to take details, customiz
HOW-TO & TIPS
5 Minutes
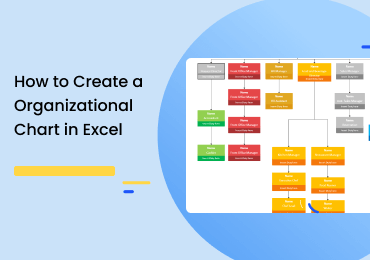
Creating an org chart inside Excel is an easy process. With five simple steps, you can add a pre-made template and edit it as you like. However, it is not the optimum method. With program evolution, t
EXAMPLES & TEMPLATES
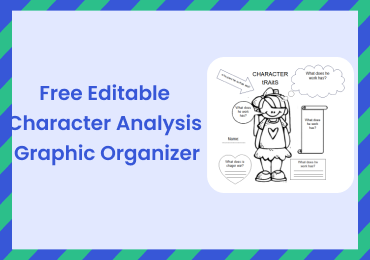
5 Minutes
A character analysis graphic organizer, described as a character map, helps the students to learn about character traits and impacts. It assists the readers in analyzing characters based on their quot
DISCOVERY
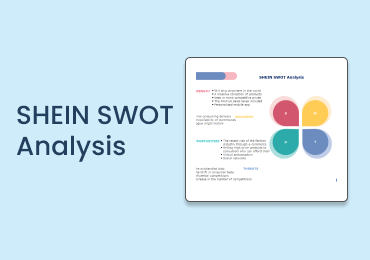
5 Minutes
SHEIN is an international B2C fast fashion eCommerce platform. Check out EdrawMax’s guide to understand SHEIN’s SWOT analysis of 2025.
EXAMPLES & TEMPLATES
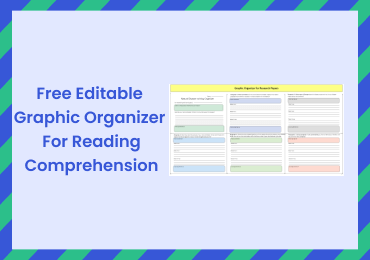
5 Minutes
Struggling readers can use the sequenced visual representation of text from graphic organizers to analyze its information. Therefore, understanding a complex write-up is much easier with a graphic org
EXAMPLES & TEMPLATES
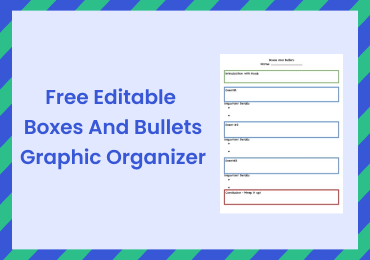
5 Minutes
Boxes and Bullets Graphic Organizers are the best for students and researchers who need improvement in their work, want to polish their raw creativity, and show the world their exquisite ideas in an o
EXAMPLES & TEMPLATES
5 Minutes
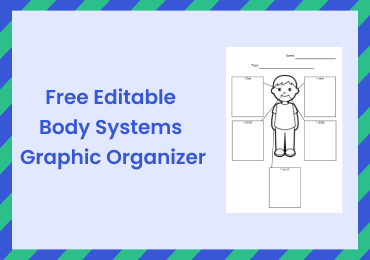
Bosy system graphic organizer can help you conveniently understand, organize and learn key biological terms, organs, and body system functions. Sign in to EdrawMax Online to draw the graphic template
DISCOVERY
5 Minutes
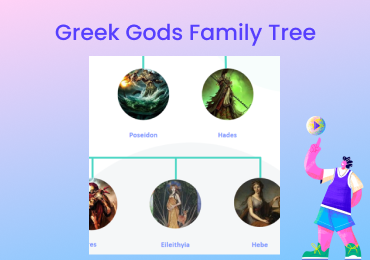
This article is undoubtedly for a history lover looking around for the Greek mythology and Greek Gods family tree. This article will help people understand how everything in Greek mythology fits into
EXAMPLES & TEMPLATES
5 Minutes
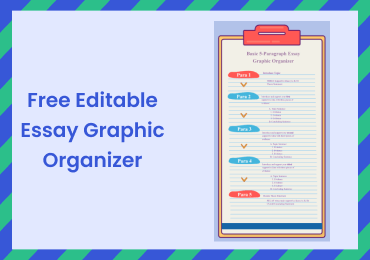
Essay graphic organizers help you plan and analyze your essay outlines in a simple and understandable way. It can be a chart, diagram, or graph that visualizes your thoughts and research in an organiz
DISCOVERY
5 Minutes
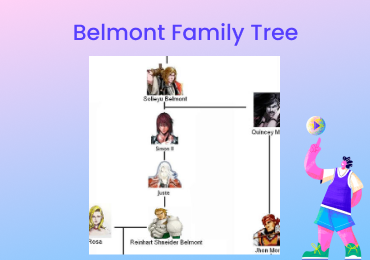
Are you curious about Belmont and Belmont family tree? We’re going to start with the most important ones and move through them in order of importance. This guide shows how the Belmont characters are i
DISCOVERY
5 Minutes
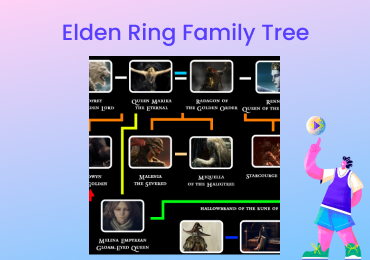
Elden Ring’s family tree is undoubtedly one of the most complex yet famous character family trees today. And EdrawMax can help you understand the relationships among them clearly.
DISCOVERY
5 Minutes
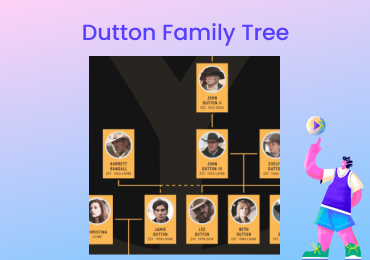
Dutton family tree is there to help you most easily understand character observations regarding one another!
DISCOVERY
5 Minutes
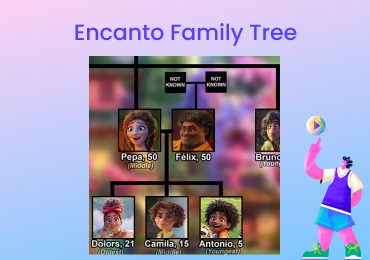
The all-time favorite Encanto family tree gets even more interesting when placed on an easy-to-understand flowchart!
HOW-TO & TIPS
5 Minutes
Whether you are trying to insert some glamour into your presentation or you just need a visual tool to make your content more palatable and attractive to the eye, this in-depth guide on how to make a
DISCOVERY
5 Minutes
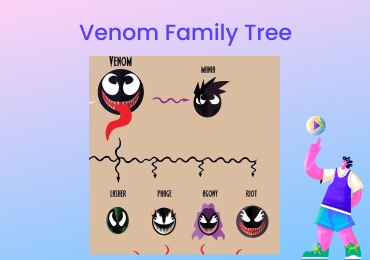
Venom is a popular spin-off series with an intriguing premise. It consists of numerous Venom symbioses for which a family tree can be created using a tool for easy comprehension.
DISCOVERY
5 Minutes
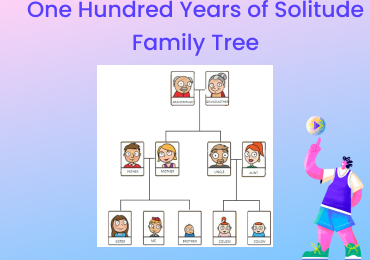
One Hundred Years of Solitude is a pinnacle of Latin American literature with a complicated family tree. You can create an understandable Buendía family tree with a special tool.
DISCOVERY
5 Minutes
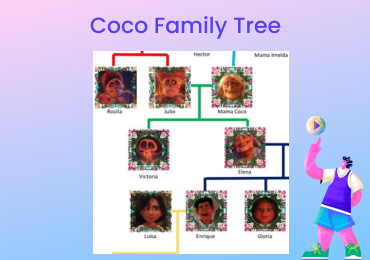
Coco will have a special place forever. However, remembering all of the names in this large family is difficult. A special tool can help you with your Rivera family tree.
DISCOVERY
5 Minutes
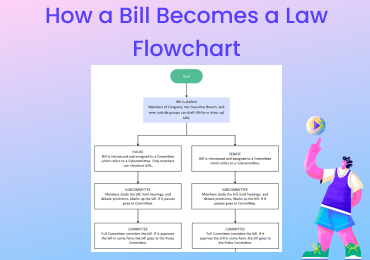
No matter how complex the process of how a bill becomes law may seem, EdrawMax can help you construct flowcharts making the process highly visually understandable.
DISCOVERY
5 Minutes
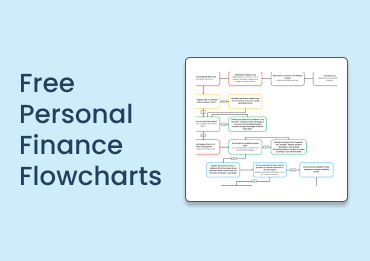
A personal finance flowchart is important for your financial condition. We have suggested just 5 simple steps with template to make a personal finance flowchart that will help you to achieve satisfact
DISCOVERY
5 Minutes
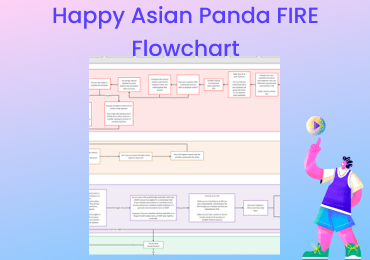
Happy Asian Panda Fire Flowchart is here to help you in capital management for early retirement plans bringing savings and investments to maximum benefit for you!
EXAMPLES & TEMPLATES
5 Minutes
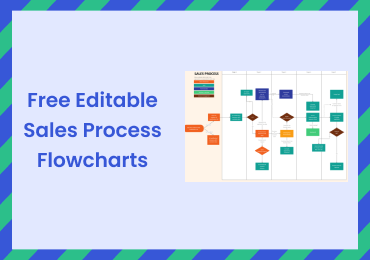
A sales process flowchart is vital to the success of any business. Get to know all its key points, steps, and best places to develop it.
EXAMPLES & TEMPLATES
5 Minutes
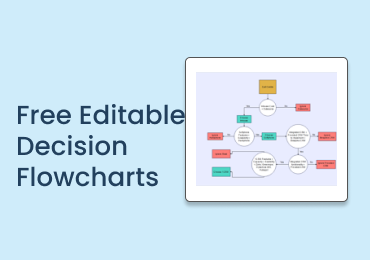
Your best resource to design free editable decision flowcharts with EdrawMax. Making a decision flowchart has never been this easy. Just design, print, share, and download.
EXAMPLES & TEMPLATES
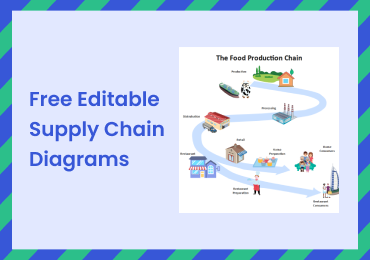
5 Minutes
Supply chains describe the steps involved in procuring raw materials to deliver products. Supply chain diagram examples help you understand how the giants in the industry gain ROI.
EXAMPLES & TEMPLATES
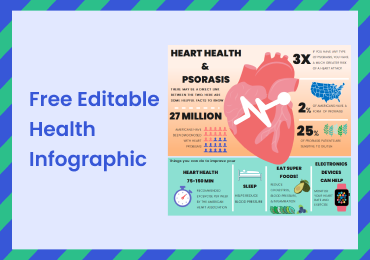
5 Minutes
Are you someone who is familiar with health concepts and would like to share your knowledge with the masses? Try creating an engaging health infographic. Read more to know the basics and importance of
EXAMPLES & TEMPLATES
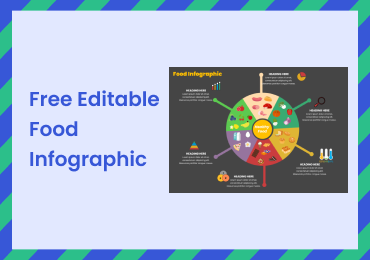
5 Minutes
Are you a foodie that admires a food infographic? Or do you love cooking? What are you waiting for then? Share your knowledge by creating a fantastic infographic! Let us discuss how.
EXAMPLES & TEMPLATES
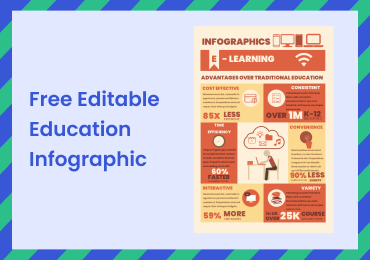
5 Minutes
Are you a teacher who loves to engage your students with some interesting education infographic? Then you are at the right place! Look at some of these examples and start designing your own, now!
EXAMPLES & TEMPLATES
5 Minutes
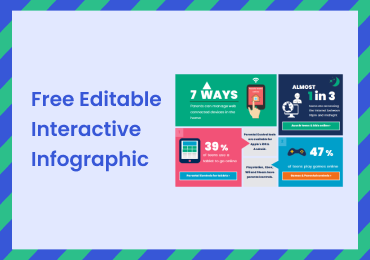
Interactive infographic is the gateway to boosting your marketing initiatives. Want to know how? Continue reading this article to learn more about interactive infographics!
EXAMPLES & TEMPLATES
5 Minutes
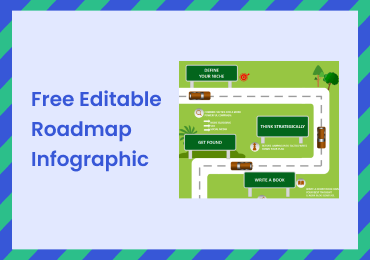
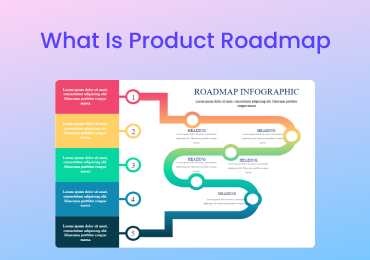
The word “Roadmap Infographic,” may sound skeptical to many, but this is your dream ticket towards achieving your long-term goals! Read more to analyze and understand the importance of roadmap infogra
EXAMPLES & TEMPLATES
5 Minutes
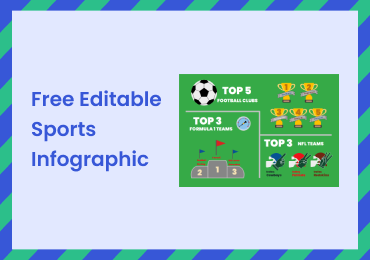
Sports infographics are combinations of text and visuals that help you convey complex data in an understandable format that is visually appealing and effective. How to exploit sports infographic tools
EXAMPLES & TEMPLATES
5 Minutes
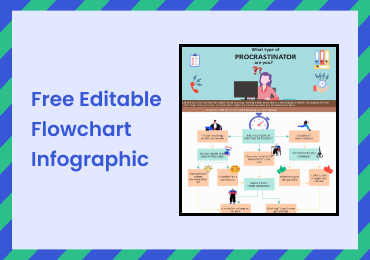
A flowchart infographic shows a sequence of involved steps in a process or actions that help increase engagement and give a very clear idea about the process and its working.
DISCOVERY
5 Minutes
The product roadmap is a shared document that provides a high-level summary of a product's features, direction, goals, and priorities and contains guidelines on how to execute product plans. It contai
DISCOVERY
5 Minutes
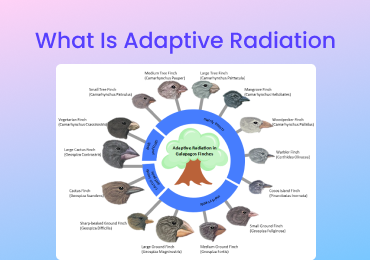
Adaptive radiation explains the process of evolution of plant or animal groups into a multitude of new species due to environmental changes and the pressure of natural selection. It helps us understan
DISCOVERY
5 Minutes
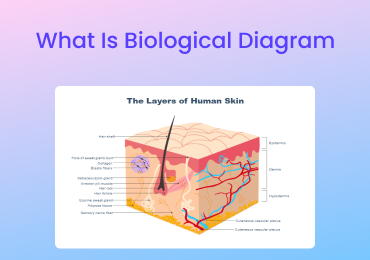
A biological diagram describes the different parts and their purpose in any specimen by depicting its internal structure. These diagrams are excellent tools to demonstrate anatomy, explain biological
DISCOVERY
5 Minutes
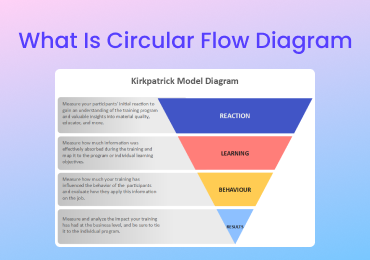
The Kirkpatrick Model is the world's best-known evaluation and analysis tool used to analyze the results of training programs in all sectors. It evaluates the programs against its four criteria levels
DISCOVERY
5 Minutes
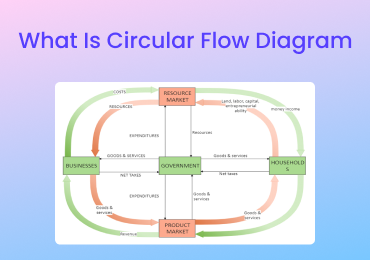
The circular flow diagram represents the flow of money in the society and the interrelation of its main components to create and raise the economy. It is a simple economic model that depicts how the e
DISCOVERY
5 Minutes
An Arrow Diagram helps you break a complicated and sophisticated project into sequential parts or activities. This diagram lets the managers allocate the resources and easily handle critical operation
DISCOVERY
5 Minutes
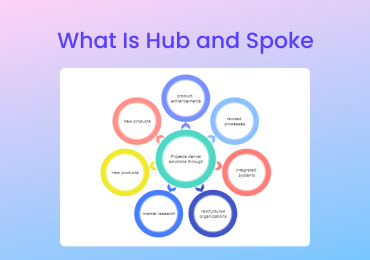
What is hub and spoke model? The layout of a hub and spoke diagrams is similar to a wheel that is mainly used to describe a large idea or component (Hub) by illustrating its smaller components and rel
DISCOVERY
5 Minutes
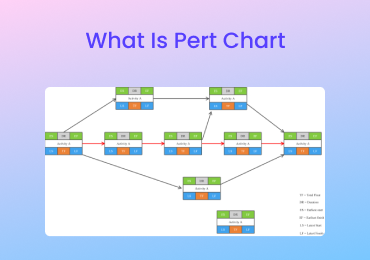
PERT Chart helps in creating a graphical representation of a project. They show the timelines, dependencies, and resources required for a project. They are used to map tasks of a project and for sched
DISCOVERY
5 Minutes
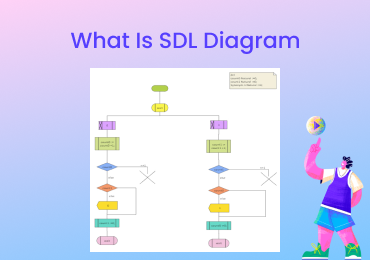
The SDL diagram depicts the graphical elements of specification and description language to model real-time, reactive systems and develop object-oriented software. You can use it to model state machin
DISCOVERY
5 Minutes
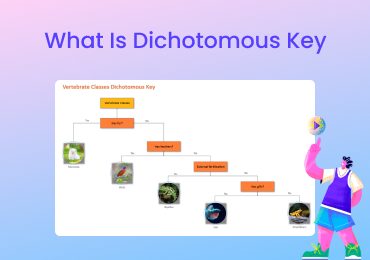
A dichotomous key is a method for identifying groups of organisms or objects by separating them into two categories, with each choice leading to the next statement until you correctly classify them. T
EXAMPLES & TEMPLATES
5 Minutes
Classroom layouts are vital for maintaining an interactive class environment. An objective-based seating pattern improves coordination and aims to achieve academic and personal goals.
EXAMPLES & TEMPLATES
5 Minutes
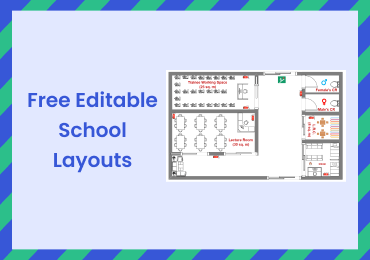
School Layouts are essential for a carefully considered architecture of the building. These diagrams aid in describing the position of different departments.

EXAMPLES & TEMPLATES
5 Minutes
Are you a car enthusiast? Want to redesign your garage so you can work on your project car? Learn how to design garage floor plans using the tips, tricks, and tools from EdrawMax.
EXAMPLES & TEMPLATES
5 Minutes
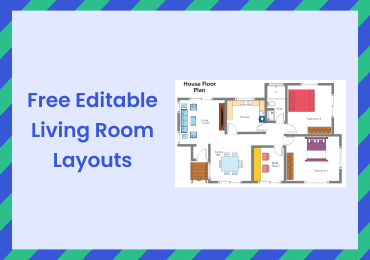
Learn how to design your living room with different principles, examples, and tips by reading below. Also, learn how to create living room layouts using EdrawMax.
EXAMPLES & TEMPLATES
5 Minutes
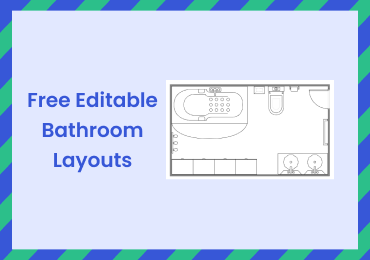
Renovate and design your bathroom with the most amazing tips and tricks and the free templates from EdrawMax! Learn how to create unique and efficient bathroom layouts in the easiest way possible.
EXAMPLES & TEMPLATES
5 Minutes
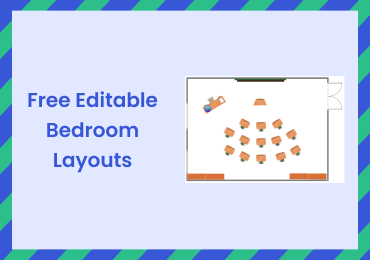
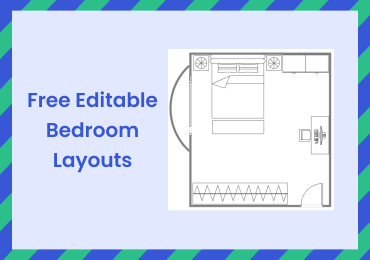
Redesign and redefine your bedroom! Use EdrawMax and design your customized bedroom layouts if you are moving into a new place or just want to do a makeover to your room!

DISCOVERY
5 Minutes
The azure architecture diagram represents the infrastructure of your cloud solutions at the present state. You can use it to illustrate core components for app development and software testing. It hel
EXAMPLES & TEMPLATES
5 Minutes
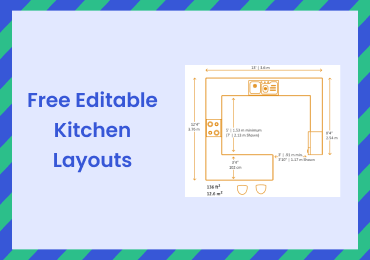
A kitchen layout does a lot more than just organizing your kitchen. It adds style and finds the perfect functionality and style with your available space.

EXAMPLES & TEMPLATES
5 Minutes
Restaurant floor plans are of great use if you want to maximize the dining space and airflow use. Restaurant floor plans help you develop your idea further before starting your construction.
DISCOVERY
5 Minutes
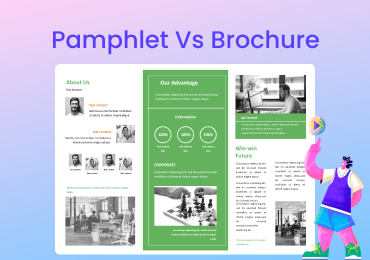
What is the difference between pamphlet vs brochure? Pamphlets are small, cheap, and used for non-commercial marketing. Brochures are large, expensive, and used for advertisements and promotions.

EXAMPLES & TEMPLATES
5 Minutes
Hotel floor plans are an excellent way to plan what you want to do with your living space. With a hotel floor plan, you can utilize the airflow, light, and space to the maximum.

EXAMPLES & TEMPLATES
5 Minutes
Your best resource to design free editable warehouse layouts with EdrawMax. Making a floor plan has never been this easy. Just design, print, share, and download.

EXAMPLES & TEMPLATES
5 Minutes
Museum floor plans are significant for visualizing or creating space for intended purposes. You can have a more substantial edge on building a perfect space with a floor plan.

EXAMPLES & TEMPLATES
5 Minutes
Learn how hospital floor plans reflect an understanding of how evidence-based design relates to outcomes and streamlines operations.
DISCOVERY
5 Minutes
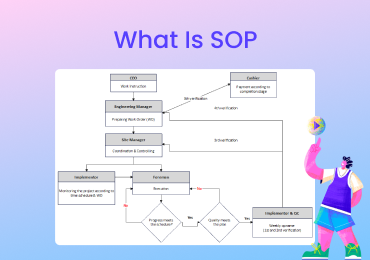
The standard operating procedure is a set of instructions specific to your operation that describes the step-by-step procedure that must be followed to complete any process.
EXAMPLES & TEMPLATES
5 Minutes
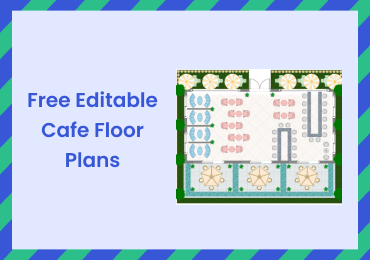
Design a cafe floor plan with EdrawMax online that your tea enthusiast audience can’t say no to.

EXAMPLES & TEMPLATES
5 Minutes
In recent decades, open floor plans have been a standard architectural design. Try EdrawMax to get ideas and custom solutions to design your own space.

EXAMPLES & TEMPLATES
5 Minutes
Shotgun houses are an interesting take on conventional houses. Are you thinking of making your shotgun house plan? Try out EdrawMax to create layouts for free.

EXAMPLES & TEMPLATES
5 Minutes
This article will explore everything you need to know before designing an apartment floor plan and introduce a tool for floor planning at the end.
DISCOVERY
5 Minutes
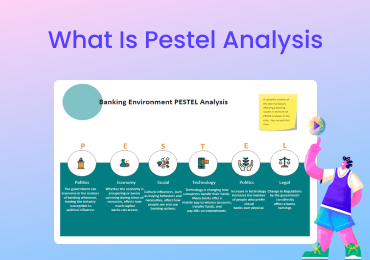
The PESTEL Analysis is a framework to assess the external environment and the factors affecting any business. Marketers and analysts use this tool to evaluate the potential threats and opportunities.

DISCOVERY
5 Minutes
This article will introduce everything you need to have before designing a roof framing plan – definition, examples and design tools

HOW-TO & TIPS
5 Minutes
Following the steps in this article will take the hassle off and easily guide you on how to draw a floor plan online.
DISCOVERY
5 Minutes
The BCG matrix in marketing analyzes the business and puts them into four categories: dogs, stars, cash cows, and question marks.

DISCOVERY
5 Minutes
The BCG matrix of Amazon shows that this ecommerce leader has many products falling into different categories, i.e., dogs, stars, cash cows, and question marks.

DISCOVERY
5 Minutes
The BCG matrix of Coca-Cola shows that this global company has many products falling into different categories, i.e., dogs, stars, cash cows, and question marks.
DISCOVERY
5 Minutes
BCG Matrix of Apple analyzes its products to classify them as low growth products, high selling products, high growth products, and high selling but low growth products. We will call them Dogs, Stars,

DISCOVERY
5 Minutes
Amazon Porter’s Five Forces shows the forces acting and helps analyze the competition and profit margin in the industry.

DISCOVERY
5 Minutes
Porter’s Five Forces for the airline industry shows the forces acting and helps analyze the passenger traffic, operating expenses, fuel prices, and landing and maintenance costs.

HOW-TO & TIPS
5 Minutes
You will learn to create a floor plan of any architecture in SketchUp and EdrawMax in this stepwise tutorial.

HOW-TO & TIPS
5 Minutes
You will learn to create a floor plan of any architecture in AutoCAD and EdrawMax in this stepwise tutorial.

DISCOVERY
5 Minutes
Netflix porter's five forces model helps us understand the strengths and weaknesses of Netflix, keeping in-depth industry assessment in perspective and leading to successful strategic planning.

DISCOVERY
5 Minutes
Porter's five forces for Apple Inc. is an excellent way to understand the dynamics of competition and different powers in any industry. Apple's success has a foundation in innovation, unique and stron

DISCOVERY
5 Minutes
Learn from Tesla Porter’s five forces analysis which provides insight into a company's current competitive position and the future stronger position. It also helps to understand areas of strength and

DISCOVERY
5 Minutes
Five factors influence the company's business strategy and performance as identified by Starbucks Porter’s five forces analysis. The coffeehouse industry is a very competitive industry with a strong f
DISCOVERY
5 Minutes
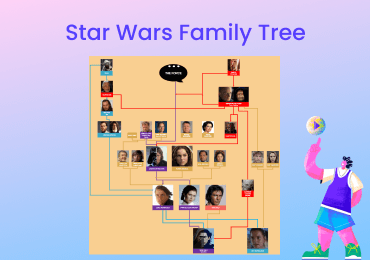
This article will be fascinating because we will discuss Star Wars and the Star Wars family tree.
DISCOVERY
5 Minutes
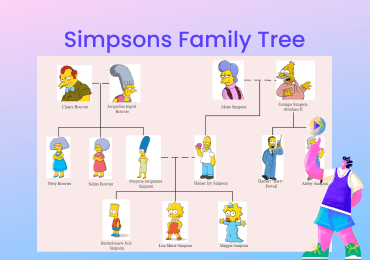
The cartoon show, Simpson family consists of fictional characters. These fictional characters are made to act in a way that makes the cartoon show famous throughout the world.
DISCOVERY
5 Minutes
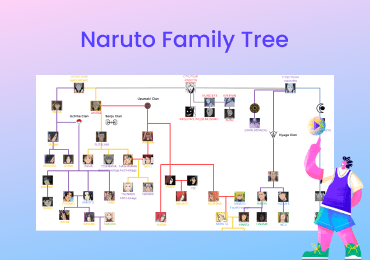
This article will discuss all the things related to naruto, the family tree of multiple clans shown in naruto.
DISCOVERY
5 Minutes
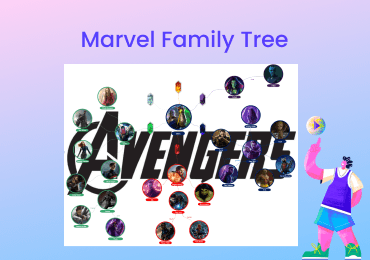
This article dives into the fascinating Universe of Marvel and introduces each Marvel character through an ultimate Marvel family tree.
DISCOVERY
5 Minutes
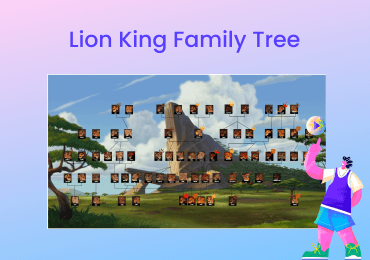
This article will get deep into the movie – Lion King and introduce you to the film's main points, like the family tree.
DISCOVERY
5 Minutes
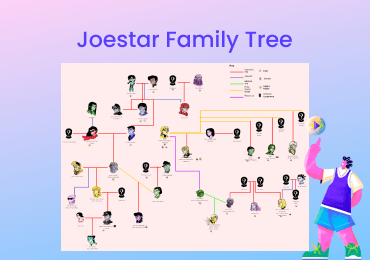
This article contains a guide to the Joestar family tree and all you need to know about the all-important characters of JoJo's Bizarre Adventure.
DISCOVERY
5 Minutes
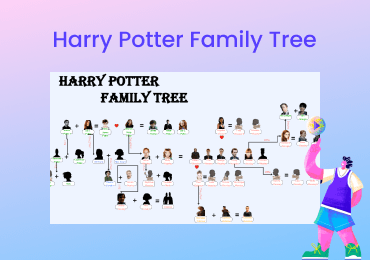
The article contains the Harry Potter family tree, Weasley family tree, Dumbledore family tree, Voldemort family tree, Black family tree, Lestrange family tree, Malfoy family tree, and Scamander famil
DISCOVERY
5 Minutes
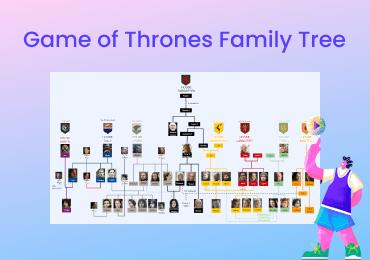
Read and learn about the epic Houses of Game of Thrones. Click to see the ultimate Game of Thrones family trees and learn how to draw them using EdrawMax.
EXAMPLES & TEMPLATES
5 Minutes
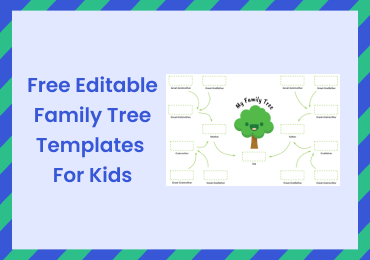
Click on this link to get some amazing, free, and editable family tree templates for your kids. Also, learn why family trees are beneficial for your kids and how you can create them using EdrawMax.
HOW-TO & TIPS
5 Minutes
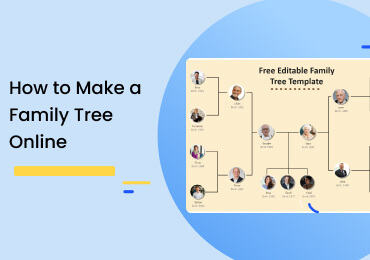
Thinking of how to make a family tree and can’t find an easy way? The beginner guide will help you create a family tree online effortlessly.

DISCOVERY
5 Minutes
A family tree clipart is also a diagram made with the help of the family tree hierarchy with some art. A family tree diagram shows us a family's lineage extended from a particular ancestor.
DISCOVERY
5 Minutes
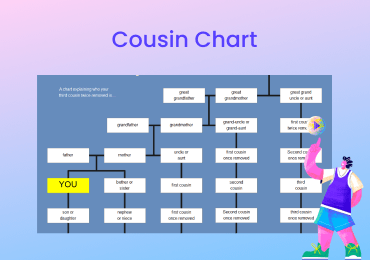
This article aims to introduce our readers to the concept of a first, second, third, and fourth cousin with cousin charts.
DISCOVERY
5 Minutes
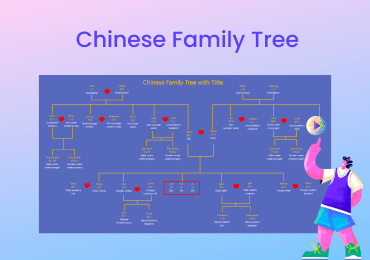
If you are a fluent English speaker and suppose you are immigrating to China for any purpose, then with time, you will find a significant difference in English and Chinese family trees.
DISCOVERY
5 Minutes
This article about the Avatar family tree will start with a brief introduction and reveal why the show is still so popular among the masses.
HOW-TO & TIPS
5 Minutes
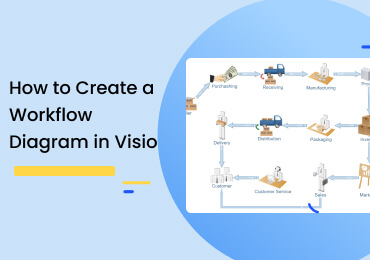
This article is about creating a workflow diagram using Microsoft Visio and EdrawMax. We will also explore some workflow diagram examples to understand how workflow diagrams are used.
HOW-TO & TIPS
5 Minutes
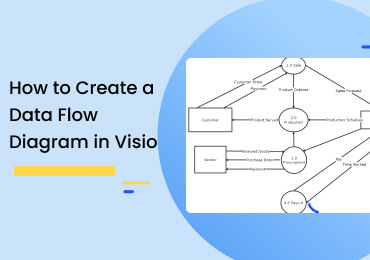
This article will explore how to make a data flow diagram in Visio and EdrawMax with easy-to-understand examples.
HOW-TO & TIPS
5 Minutes
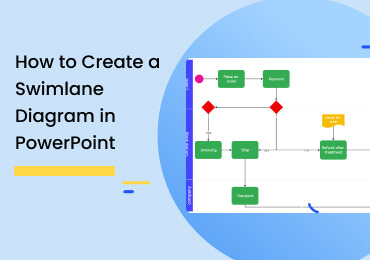
This article shows how to design a swimlane diagram in Microsoft Powerpoint with examples. We will also introduce EdrawMax, from which you can easily create a compelling and insightful swimlane diagra
HOW-TO & TIPS
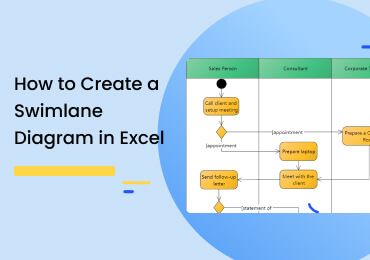
5 Minutes
This article is for you to learn how to create a swimlane diagram with Microsoft Excel and EdrawMax - a fantastic diagramming tool.
HOW-TO & TIPS
5 Minutes
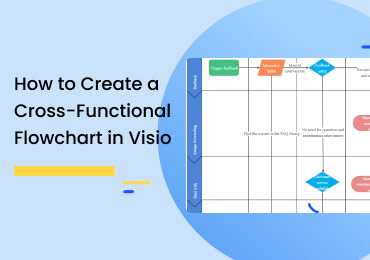
If you want to make a cross-functional flowchart diagram in Visio, this article is the best guide. We have also included the most efficient and trending tool called EdrawMax to innovate your process.
DISCOVERY
5 Minutes
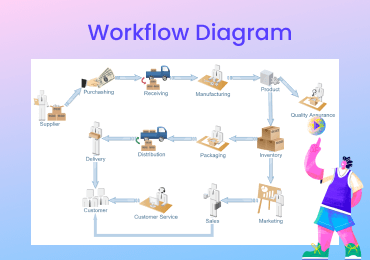
A workflow diagram is a tool for visualizing various business processes and as such, is a vital tool. In this tutorial, learn all there is to about workflow diagrams.
DISCOVERY
5 Minutes
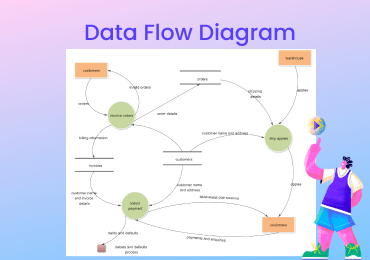
et to know what a Data Flow Diagram is and create a DFD in minutes with Edraw Max. This guide on DFD includes numerous real-world examples.
DISCOVERY
5 Minutes
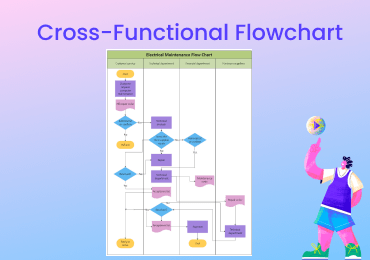
This article is about cross-functional flowcharts with some examples. There also introduces essential steps in making one and an online tool to design cross-functional flowcharts.

DISCOVERY
5 Minutes
Get to know the essentials of BPMN and learn to create a BPMN diagram effortlessly with the intuitive BPMN diagram tool. It's free and simple!
DISCOVERY
5 Minutes
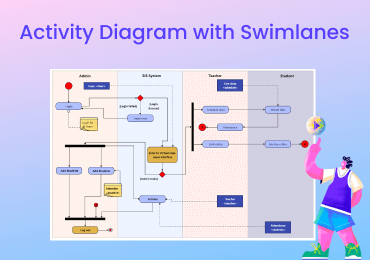
This article will explore the swimlane activity diagram with examples and tell you how to make an activity diagram with swimlanes.
DISCOVERY
5 Minutes
This article is about git flow diagrams, one of the competent tools for developers working on complex projects. We have also introduced EdrawMax, one of the most efficient tools to create a git-flow d
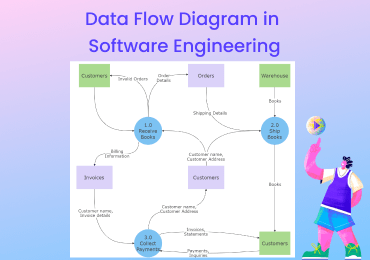
DISCOVERY
5 Minutes
This article discusses applying a data flow diagram in software engineering processes with some thumb rules and methods to create one in EdrawMax.
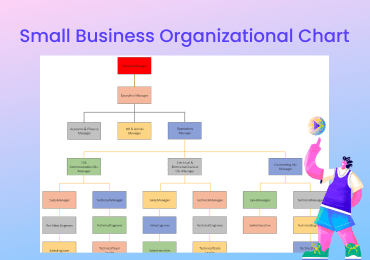
DISCOVERY
5 Minutes
This article will tell you what a small business organizational chart is, how it is made, and why it is essential for your business.
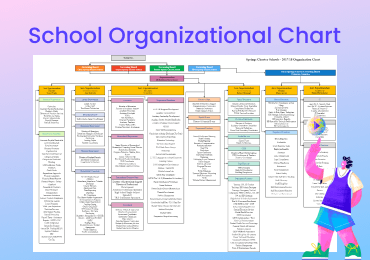
DISCOVERY
5 Minutes
Learn what a school organizational chart is and make a perfect one with the best online tool.
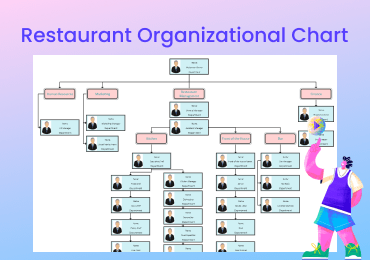
DISCOVERY
5 Minutes
In this article, you will get information about restaurant organizational charts and the best tool for making a perfect and exemplary restaurant organizational chart.
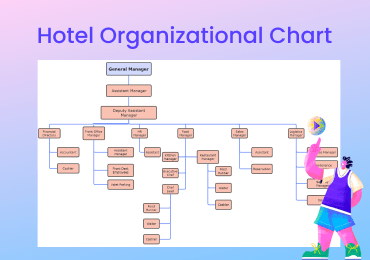
DISCOVERY
5 Minutes
Get to know what a hotel organizational chart is and how to make a perfect hotel organizational chart with EdrawMax.
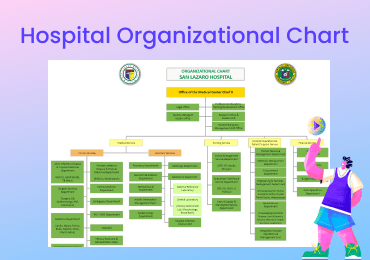
DISCOVERY
5 Minutes
This article is about how to make a perfect hospital organizational chart and its importance.
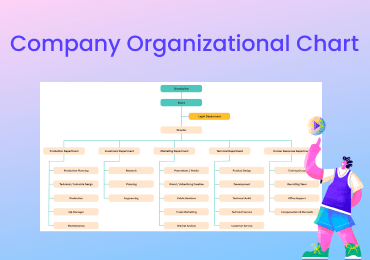
DISCOVERY
5 Minutes
The article will familiarize you with all the nuts and bolts of the company organizational chart, its use, and how to make it.
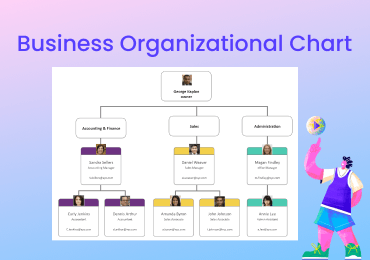
DISCOVERY
5 Minutes
A business organizational chart is an abstract view of the whole organization, which tells us the relationship between multiple entities working inside the organization.
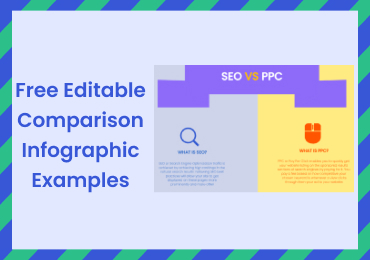
EXAMPLES & TEMPLATES
5 Minutes
Comparison infographics are used in business competitor reviews, product comparisons, student comparisons, etc. Let us review some comparison infographic examples and see recommendations for the best
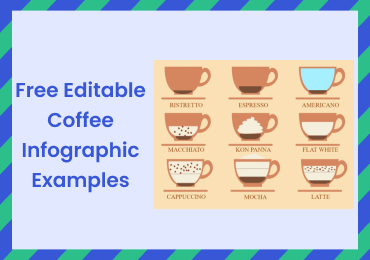
EXAMPLES & TEMPLATES
5 Minutes
Coffee infographics are beautiful but can be complicated to develop. Let us review some coffee infographic examples and see how easy it is to develop them in EdrawMax online infographic maker.
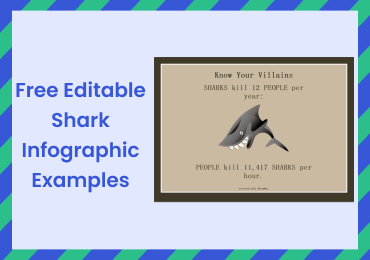
EXAMPLES & TEMPLATES
5 Minutes
Sharks are endangered species, and EdrawMax shark infographic templates are a great way to raise awareness to save their lives and help the ocean ecosystem using text and images.
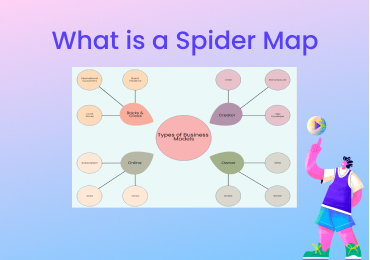
DISCOVERY
5 Minutes
What is a spider map? A spider map is a learning and organizational tool that create a visual framework for students and professionals to brainstorm ideas and complete their tasks. It depicts the...
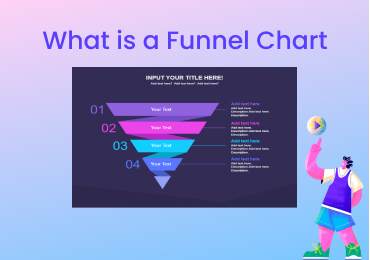
DISCOVERY
5 Minutes
A funnel chart illustrates the flow of data and its progressive reduction as it moves from one stage to another in a process. A funnel chart summarizes data in an inverted triangle. You can use it to
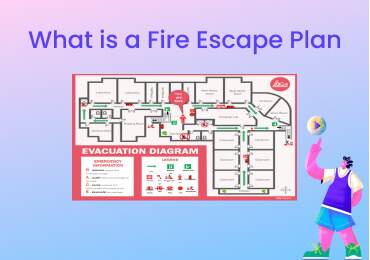
DISCOVERY
5 Minutes
A fire escape plan increases the chances of you and your family safely getting out of the house in case of a fire or emergency. Make a fire escape plan with your family, conduct drills, and check...
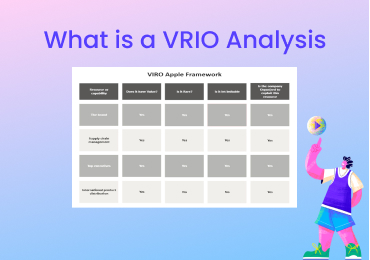
DISCOVERY
5 Minutes
The VRIO analysis illustrates which resources are valuable, rare, and costly to imitate in a company. It also evaluates whether the company is organized to use these resources and sustain its...
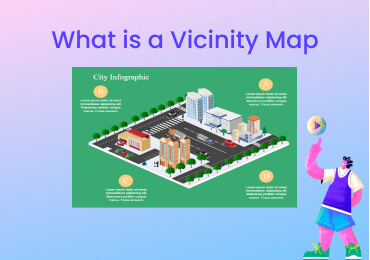
DISCOVERY
5 Minutes
What is a vicinity map? A vicinity map depicts the site of a project or a small area and the prominent landmarks in its proximity. You can use it to graphically represent anything you want...
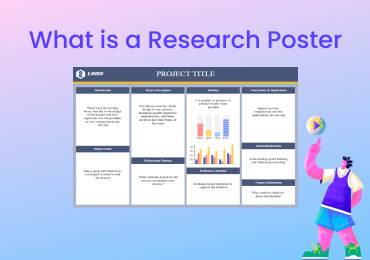
DISCOVERY
5 Minutes
A research poster is commonly used in academics and group presentations, and it depicts the general overview of research by listing its main elements such as introduction, findings, and methods.
DISCOVERY
5 Minutes
What is a lotus diagram? It is a tool to brainstorm ideas and explore any topic or problem components. You can use it to outline your writing and solve complex problems.
DISCOVERY
5 Minutes
What is a KWL chart? A KWL chart is a graphic organizer that help students learn new topics and organize information. Teachers use these charts to monitor their students' improvement and engage them..
DISCOVERY
5 Minutes
The double bubble map helps you do comparisons and smooth brainstorming sessions. These maps create a visual framework for thinking and generating new ideas.
DISCOVERY
5 Minutes
Use a bubble map to describe nouns and topics with adjectives and visualize their relationships. Teachers use these maps as a creative thinking activity for their students.
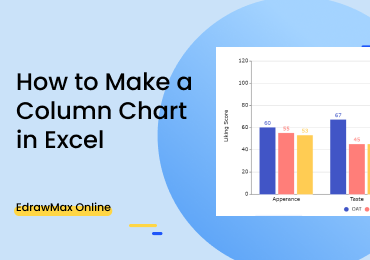
HOW-TO & TIPS
5 Minutes
Learn how to create a column chart in Excel with our tutorial! Moreover, this tutorial also guides you on how to create a column chart in EdrawMax Online.
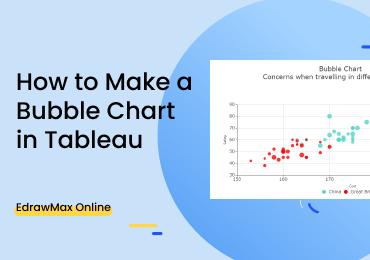
HOW-TO & TIPS
5 Minutes
This tutorial teaches you how to make a bubble chart in Tableau easily and efficiently. Learn how to make a bubble chart with free-templates!
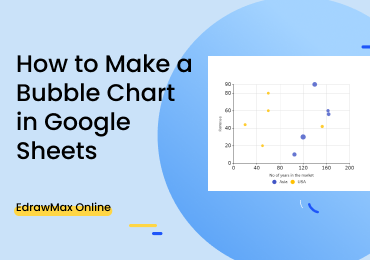
HOW-TO & TIPS
5 Minutes
With this tutorial on how to make a bubble chart in Google Sheets, you can easily make a bubble chart of your own preference.
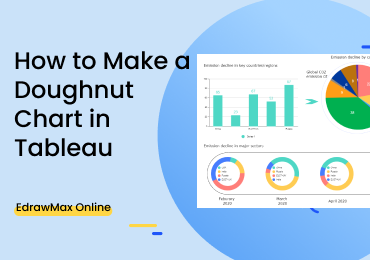
HOW-TO & TIPS
5 Minutes
This step-by-step guide will show you how to create a doughnut chart in Tableau and how to customize a doughnut chart.
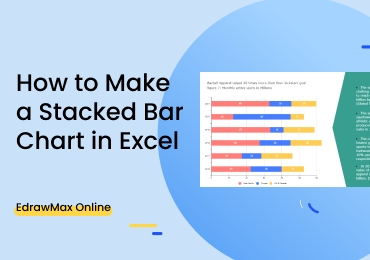
HOW-TO & TIPS
5 Minutes
Learn how to create a stacked bar chart in Excel with our free tutorial. Just follow the instructions and you’ll have your stacked bar chart ready in no time.
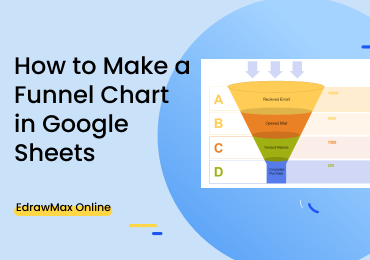
HOW-TO & TIPS
5 Minutes
Are you looking for an easy way to make a funnel chart in Google Sheets? This step-by-step guide will teach you how to make a funnel chart in Google Sheets without any hassle.
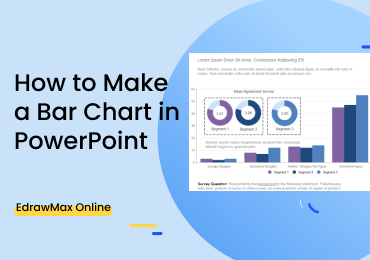
HOW-TO & TIPS
5 Minutes
This step-by-step guide will teach you how to make a bar chart in PowerPoint. Follow the steps below to learn how to make and customize a bar chart in EdrawMax Online, easier than in PowerPoint.
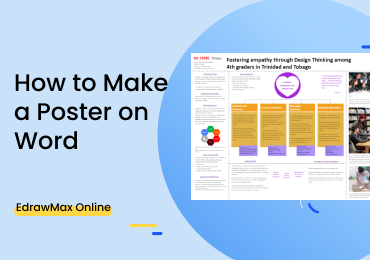
HOW-TO & TIPS
5 Minutes
Learn how to make a poster on Word with a free online tutorial! This step-by-step guide teaches you how to make a poster on Word with pre-made templates.

HOW-TO & TIPS
5 Minutes
A step-by-step guide with screenshots teaches you how to make a customized banner in Word quickly and efficiently. Create a banner in EdrawMax Online with free banner templates!
EXAMPLES & TEMPLATES
5 Minutes
The double bubble map templates are tools for comparison and brainstorming, and you can use them to compare and contrast two ideas or entities. These are also very helpful in problem-solving.
EXAMPLES & TEMPLATES
5 Minutes
Use brainstorming examples to solve problems with out-of-the-box thinking. Generate creative ideas and share your knowledge with others during brainstorming sessions to reach your goal.
HOW-TO & TIPS
5 Minutes
Learn how to make a flyer on Google Docs with this step-by-step tutorial. Get inspired by flyer examples and not limited by Google Docs.
HOW-TO & TIPS
5 Minutes
Learn how to create a six sigma chart in Excel and Edraw Max Online using our step-by-step guide. Make a six sigma chart in excel and Edraw Max quickly and efficiently!
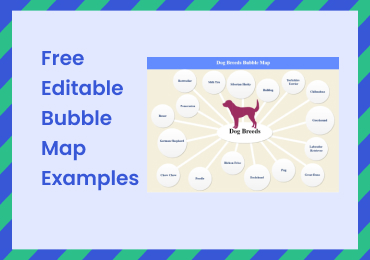
EXAMPLES & TEMPLATES
5 Minutes
Use bubble map examples to describe nouns with adjectives and showcase relationships between related themes. Give students a creative learning experience and plan out new strategies with bubble maps.
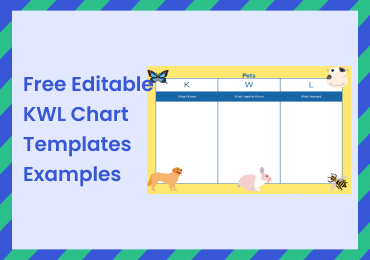
EXAMPLES & TEMPLATES
5 Minutes
Create KWL charts using our KWL chart templates on EdrawMax Online. Our examples will help you understand these charts' various types and uses. Learn which KWL chart format is best for teaching purpos
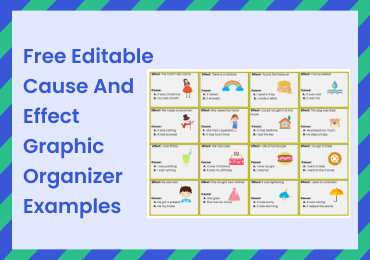
EXAMPLES & TEMPLATES
5 Minutes
The cause-and-effect graphic organizer helps you understand, identify and construct ideas. You can use it to organize information and for better reading comprehension, and it also allows you to determ
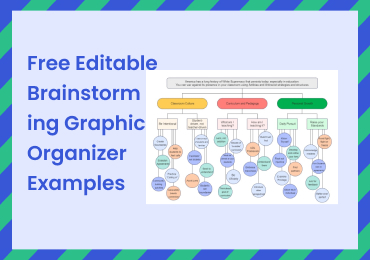
EXAMPLES & TEMPLATES
5 Minutes
You need a brainstorming graphic organizer for a smooth brainstorming session. Students can use it to improve their writing skills, and professionals can use it to make plans and strategies with it.
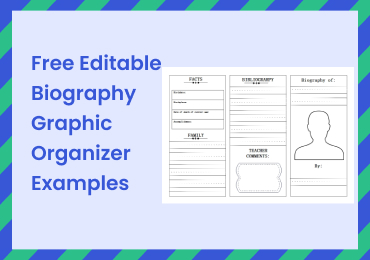
EXAMPLES & TEMPLATES
5 Minutes
You can quickly write someone's biography with a biography graphic organizer. It helps you gather and organize key information, create timelines, and improve your research skills. Use our templates to
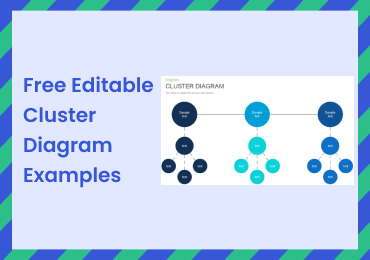
EXAMPLES & TEMPLATES
5 Minutes
A cluster diagram template helps you create a diagram with clusters of discrete elements and ideas for brainstorming and organizing information. Learn about its types and uses from our cluster diagram
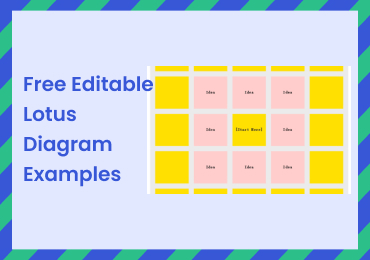
EXAMPLES & TEMPLATES
5 Minutes
Are you looking for a brainstorming and management tool? A lotus diagram template is the best creativity tool for organization and problem-solution. Check out our examples and go to EdrawMax Online to
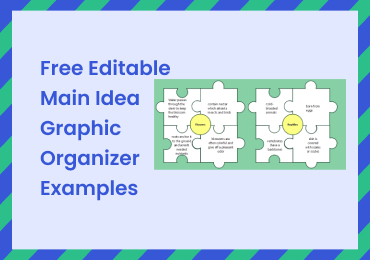
EXAMPLES & TEMPLATES
5 Minutes
Here are the most commonly used main idea and details graphic organizer examples. Use our templates to create your main idea web in a few clicks on EdrawMax Online.
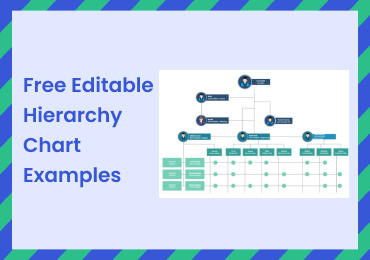
EXAMPLES & TEMPLATES
5 Minutes
Create a hierarchy chart using our hierarchy chart templates to save time and effort. Find out about its uses and various formats for our examples and learn which online chart maker is best for making
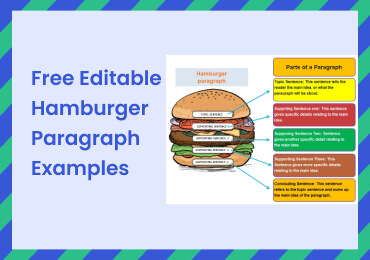
EXAMPLES & TEMPLATES
5 Minutes
Make a creative hamburger graphic organizer with our hamburger paragraph templates. Learn about its various formats and uses from our paragraph hamburger examples and pick a suitable template for assi
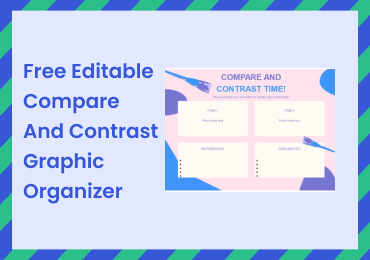
EXAMPLES & TEMPLATES
5 Minutes
Learn about the types and uses of compare and contrast graphic organizers from our example templates. With our templates, you can save time and effort. Pick the template you want and go to EdrawMax On
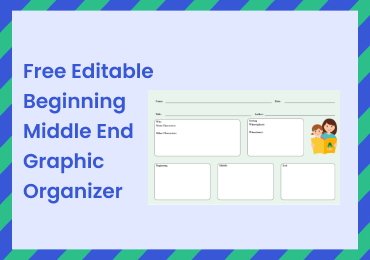
EXAMPLES & TEMPLATES
5 Minutes
With a beginning middle end graphic organizer, students can map their stories and create a pre-writing outline. Learn about graphic organizer types and uses from our BME graphic organizer examples. Us
HOW-TO & TIPS
5 Minutes
We will tell you everything you need to create and use tape diagrams to solve math problems and share concepts. Follow our five-step procedure draw a perfect tape diagram right now.

HOW-TO & TIPS
5 Minutes
How to design digital logic? You can easily create a digital logic design within five simple steps. We will tell you the steps to develop a digital logic, a few essential tips, and which diagramming s
HOW-TO & TIPS
5 Minutes
How to create a pamphlet? You can easily make a pamphlet after defining your purpose and using an attractive template. You have to write creative content and include a selling pitch, so the audience w
HOW-TO & TIPS
5 Minutes
A swimlane diagram adds up the details of the departments and employees to determine who is assigned and how they can collectively attain a goal. Read and learn how to create a swimlane diagram.
HOW-TO & TIPS
5 Minutes
A BPMN diagram is similar to a flowchart that helps you analyze and depict the information flow of any process. Read more to learn how to create a BPMN diagram.
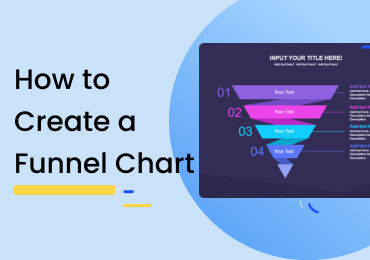
HOW-TO & TIPS
5 Minutes
You can use a funnel diagram to visualize the connection between data values based on a descending hierarchy. It helps you summarize data in large quantities by dividing it into various stages.
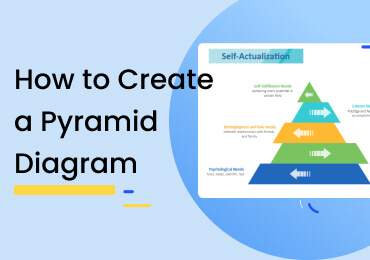
HOW-TO & TIPS
5 Minutes
A pyramid chart depicts any idea or topic in a triangular structure based on hierarchies. It is commonly used to classify information by dividing it into sections of various sizes.

HOW-TO & TIPS
5 Minutes
The AWS architecture diagram is the visual representation of application designs and structures built on AWS cloud services. You can create AWS diagram to depict the interaction between various compon

HOW-TO & TIPS
5 Minutes
The azure architecture diagram is an essential part of creating designs for your applications and finding solutions. Learn how to create Azure Architecture Diagram.
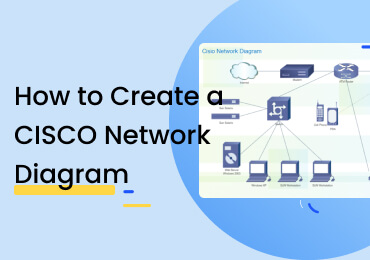
HOW-TO & TIPS
5 Minutes
A cisco network diagram visually represents the structure and components of a network. It is commonly used by IT experts to design layouts for network topologies and to structure networks.
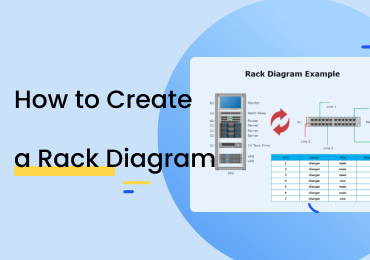
HOW-TO & TIPS
5 Minutes
You can easily create a rack diagram if you understand rack components, icons and network designs. A racking diagram depicts the optimized placement for various rack items.
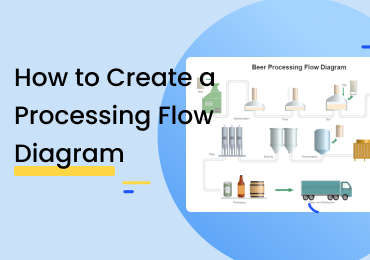
HOW-TO & TIPS
5 Minutes
PFD visually represents the connection between components and various activities involved in any process. Read the article and learn how to create a process flow diagram.
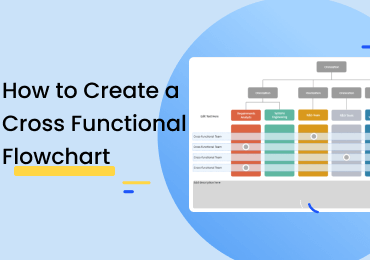
HOW-TO & TIPS
5 Minutes
Cross-functional flowcharts give a multidimensional aspect to conventional flowchart to increase the depth of information delivered visually. Learn more about how to create a cross-functional flowchar
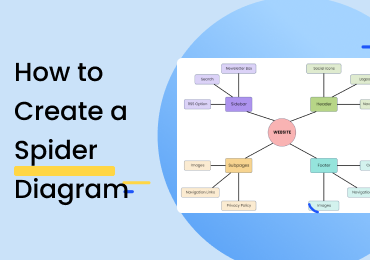
HOW-TO & TIPS
5 Minutes
Creating a spider diagram with EdrawMax Online isn’t that tough of a job. Check out this post for a comprehensive tutorial on how to pull it off like a pro.

HOW-TO & TIPS
5 Minutes
Don’t know how to make a postcard design yourself? In this article, you can create one from scratch or use an existing template for a quicker fix.

HOW-TO & TIPS
5 Minutes
This article talks about invitation cards. Why are they important for society, as well as a step-by-step guide on how to make an invitation card on EdrawMax and tips to create it.

HOW-TO & TIPS
5 Minutes
To learn how to make a thank you card, check out this comprehensive guide. We are taking a look at a step-by-step tutorial on using the software and coming up with stylish and aesthetic thank you card

HOW-TO & TIPS
5 Minutes
This article talks about birthday cards. Why are they important in peoples lives, as well as a step-by-step guide on how to make a birthday card on EdrawMax and tips to create it.

HOW-TO & TIPS
5 Minutes
If you want to make a business card, why not use a custom design instead of a preset template? To learn how to make a business card, check out this post for a comprehensive guide.
DISCOVERY
5 Minutes
Pedigree Chart helps in tracing certain phenotypes of genes within an ancestry, genetic disorders and to predict possible illness in individuals. Read the post to learn more about pedigree symbols.
DISCOVERY
5 Minutes
Ladder Diagram Symbols are the building blocks of ladder diagrams and they are also called ladder logic symbols. Every Ladder Symbol represents a certain ladder instruction. Learn the common-used ladd
DISCOVERY
5 Minutes
Logic Gate Symbols are the graphical representation of the logic gates which are usually used to make digital circuits. Read the article to learn more.
DISCOVERY
5 Minutes
What are fault tree analysis symbols? Fault Tree Analysis is a diagram used to represent different causes of system failure. Three types of fault tree analysis symbols are gates, events, and transfer
DISCOVERY
5 Minutes
Presentation Clipart is a collection of media files, including images, videos, audio, gifs, and animation files. Presentation clipart helps present work, projects, ideas, and research about a topic.
DISCOVERY
5 Minutes
Infographics use images, graphs, infographic symbols, and numbers to deliver information fast but in a visually attractive way. Infographic icons summarize and communicate complex information and idea
DISCOVERY
5 Minutes
Genogram symbols are categorized into many types, such as family and relationship genogram symbols, emotional symbols, medical symbols, etc.
DISCOVERY
5 Minutes
Venn diagrams show the mathematical or logical relationship between different sets through specific Venn diagram symbols. It shows logical relationships between different groups of sets.
HOW-TO & TIPS
5 Minutes
A spider chart is quite a complex representation if you try to make it by hand. Use EdrawMax Online instead to save time and effort in your work. Check out this guide on how to create a spider chart.
HOW-TO & TIPS
5 Minutes
Check out this post for a detailed guide on creating a comparison chart with EdrawMax Online. Adding values, changing styles, and customizing graphics is a total breeze with this web-based diagramming
HOW-TO & TIPS
5 Minutes
Finding it difficult to make a gauge charts? In this guide, you will learn some basics about gauge charts and how to create gauge chart quickly.
HOW-TO & TIPS
5 Minutes
Creating a stacked area chart with EdrawMax Online is smooth and straightforward. Check out this post for a step-by-step tutorial on using the web-based application for your diagramming needs.
HOW-TO & TIPS
5 Minutes
Doughnut charts are an excellent way to represent the percentages of various quantities in a group of data. In this post, we are looking at how you can create the same using EdrawMax Online.
HOW-TO & TIPS
5 Minutes
In this guide, you will learn some basics about clustered column charts and how to draw clustered column chart quickly.

HOW-TO & TIPS
5 Minutes
In this post, we will learn how you can create an electrical floor plan using templates, icons, and much more. EdrawMax Online makes diagramming easy and fun!
HOW-TO & TIPS
5 Minutes
Not sure how to draw a subway map? In this post, we are taking a look at a step-by-step guide to help you create awesome subway maps and layouts using the many features and perks using EdrawMax Online
HOW-TO & TIPS
5 Minutes
Don't know how to draw a city map? No need to worry. Check out this post to find out how to come up with professional-looking graphics using EdrawMax Online!
HOW-TO & TIPS
5 Minutes
Do you find it hard to create an isometric map? Check out this post to learn how you can create one in an instant using EdrawMax Online!
EXAMPLES & TEMPLATES
5 Minutes
Your YouTube channel must be appealing and aesthetic for popularity. A significant part of this can be accomplished with an aesthetic YouTube banner. You need to be creative, analytical and have acces
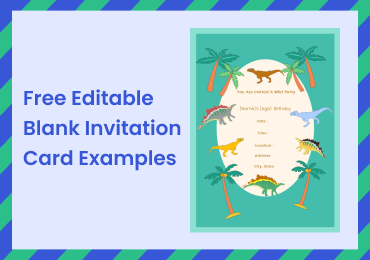
EXAMPLES & TEMPLATES
5 Minutes
A blank Invitation card is used to invite people to events like Birthday parties, success parties, anniversaries, and weddings; the design of invitation cards is so important that sometimes people dec

EXAMPLES & TEMPLATES
5 Minutes
A well-designed postcard example is a perfect choice to send greetings and messages to your loved ones. If you don't want to start from scratch and appreciate some foundation work for your postcard ex
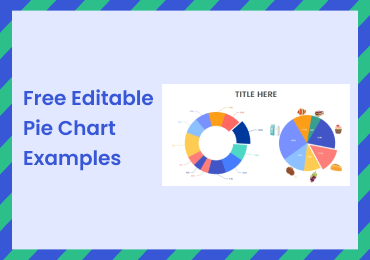
EXAMPLES & TEMPLATES
5 Minutes
A pie chart is a circular graph that visualizes data as a whole, and it depicts data comparison of a single data set by cutting the graph into slices. We use pie charts when we want the audience to ge

EXAMPLES & TEMPLATES
5 Minutes
Formal business meetings and introducing your services to your clients is the job of every person in business. With a sound business card, it gets a lot easier to make the best first impression of you
DISCOVERY
5 Minutes
Lean practitioners employ the VSM to identify the potential for reducing process cycle time and material for process improvement. VSM is a technique that uses value stream mapping symbols to create a
DISCOVERY
5 Minutes
UML diagrams are used to describe different components and scenarios of a software system. These are made using the standard UML notations and symbols to understand systems across the board for all st
EXAMPLES & TEMPLATES
5 Minutes
The UML diagram is essential in software engineering, business, and architecture, and it also helps with system analysis and modeling ideal system designs. The UML diagram examples here give you many
EXAMPLES & TEMPLATES
5 Minutes
A swimlane diagram is a flow chart that illustrates the goal and reason behind each activity in a process flow. Find out which format of a swimlane chart is ideal for you from our swimlane diagram exa
EXAMPLES & TEMPLATES
5 Minutes
Line graphs are helpful when you want to illustrate data changes for a particular period of time. It is mainly used in finance to track both small and large data changes. Find more free line graph ex
EXAMPLES & TEMPLATES
5 Minutes
To create a pyramid chart, you have to pick a specific layout that suits your needs. With our examples of pyramid charts, you can select the right one and get a template to create it online in no time
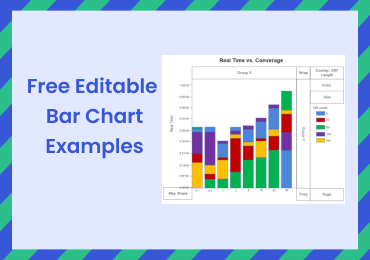
EXAMPLES & TEMPLATES
5 Minutes
We use bar charts to illustrate the comparison between data groups and the distribution of data trends based on their numerical values. You can see the various bar charts from our bar chart examples a
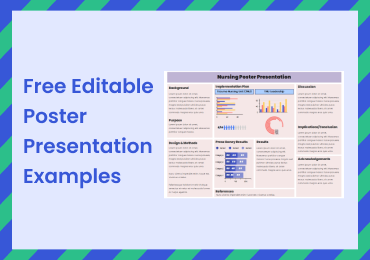
EXAMPLES & TEMPLATES
5 Minutes
A poster presentation is a short, concise yet clear way of communicating your research, study findings, concepts, and ideas. Read the article and find more free scientific poster examples.
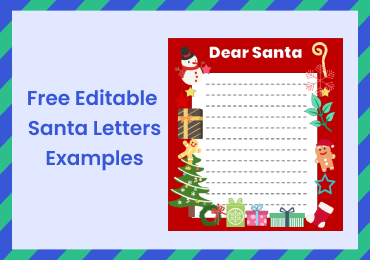
EXAMPLES & TEMPLATES
5 Minutes
You can make this Christmas special for your kids with a Santa letter templates. Your kids can use these templates to write letters to Santa, and you can also use them to give them a reply from Santa.
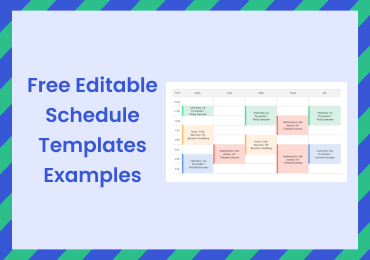
EXAMPLES & TEMPLATES
5 Minutes
An organized schedule is a great way to stay on top of your appointments and time management. A blank schedule template is a form that has editable sections that you can fill in to create your customi
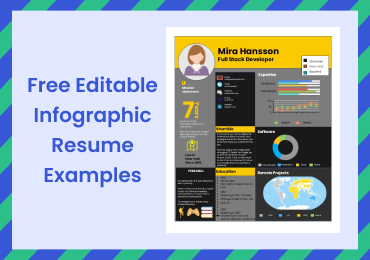
EXAMPLES & TEMPLATES
5 Minutes
An infographic resume template helps you make a resume using charts and icons to make it more appealing and showcase your expertise and creativity. Try EdrawMax Online and make your infograpgic resume
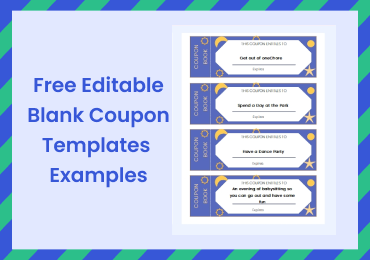
EXAMPLES & TEMPLATES
5 Minutes
Coupons and deals play a critical role in the current e-commerce age. A blank coupon template helps your promotion to stand out from the rest. You can use blank coupon templates to make customized cou
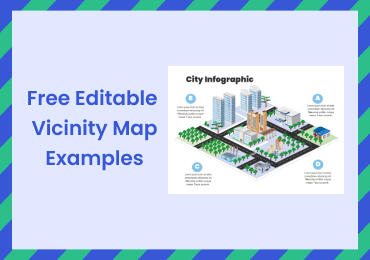
EXAMPLES & TEMPLATES
5 Minutes
A vicinity map shows the site of an event, project, or activity to reference general layout and configuration. You can add as much detail as you want and improve readability with labeling and legends.
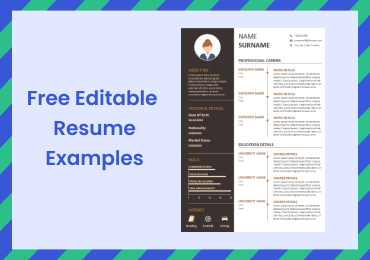
EXAMPLES & TEMPLATES
5 Minutes
You need an excellent resume to get the job if you like. You can use blank resume templates to save your time and effort. Get the resume template that is ideal for your job and fill it out. Make a few
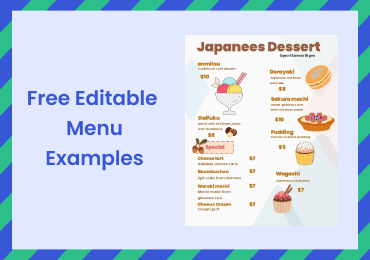
EXAMPLES & TEMPLATES
5 Minutes
Blank menu templates play a vital role in making a food business or a restaurant profitable. The best part of these templates is that they are easy to create, and you can design them based on your res
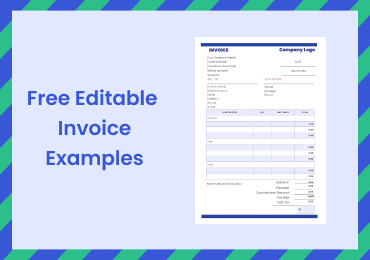
EXAMPLES & TEMPLATES
5 Minutes
Invoices are a critical part of any business for the legal records, sales tracking, forecasting, and audits as well. A blank invoice template provides a structure to fill in details of the sale and se
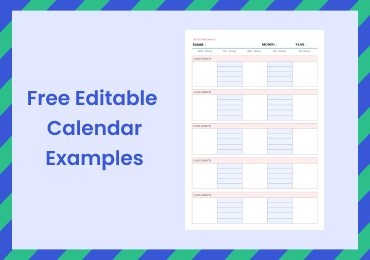
EXAMPLES & TEMPLATES
5 Minutes
Calendar templates are types of personal information managers that help with schedules and planning. An editable blank calendar template allows you to use calendars in multiple ways.

DISCOVERY
5 Minutes
Lab safety symbols include representations of safety equipment used in the laboratory. People working in the labs must use safety equipment, lab safety measures, and hazard control and management.
DISCOVERY
5 Minutes
What are P&ID symbols? P and ID symbols are used in engineering system designs to represent process working and sequence. The most popular symbols are actuators, equipment, flow elements, instrumentat
DISCOVERY
5 Minutes
We use chemical symbols as the standardized language for chemistry. Suppose you want to explain something in chemistry, then you need to understand various types of chemical symbols and their uses. It
DISCOVERY
5 Minutes
What are biology symbols and biology icons? Many teachers, students, awareness campaigns, and scientists need biology symbols to represent various functions of plant cells, animal cells, anatomy...
DISCOVERY
5 Minutes
We use physical symbols to represent various quantities and equations. There are six branches of physics, and all of these branches deal with their respective disciplines that involve many equations..
DISCOVERY
5 Minutes
Science diagrams give you a detailed visual representation by using scientific symbols.Making a science diagram becomes easier with EdrawMax Online and its science symbols library.
DISCOVERY
5 Minutes
A process map is a management and planning tool for a visual representation of the workflow. Read the article to learn more about the process map symbols.
DISCOVERY
5 Minutes
What are reflective ceiling plan symbols? Reflected plan symbols include lights, smoke detectors, light fixtures, lighting panels, sprinklers, speakers, cameras, monitors, grilles/diffusers for HVAC g
DISCOVERY
5 Minutes
Basic network diagram symbols are essential to make a clear and detailed presentation. Using icons and shapes to represent components of a network makes your diagram easier to understand.
DISCOVERY
5 Minutes
What are floor plan symbols? Floor plan symbols help create correct floor plans that all team members understand across the board because of the standard symbols and notations.

DISCOVERY
5 Minutes
Chlorine gas has a yellowish-green color and a pungent smell which creates a choking effect. Chlorine is mainly used as a disinfectant. Learn more about Chlorine and its experiment from this article!

DISCOVERY
5 Minutes
The equation determining the relation between the force and the extension of the object is known as Hooke's Law. In this article, it discusses what is Hooke's Law and how to make it online easily!

DISCOVERY
5 Minutes
A ray diagram shows the path that the ray of light follows while passing through the lens. In this article, it discusses what is convex lens and how to make its diagram online with ease!
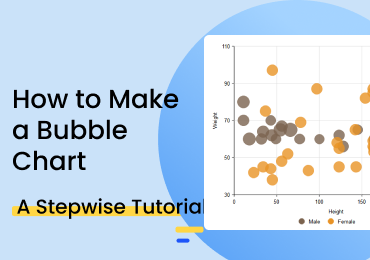
HOW-TO & TIPS
5 Minutes
In this article, we talk about what a bubble chart is, what things we need before creating one, its variables and how to create a bubble chart.
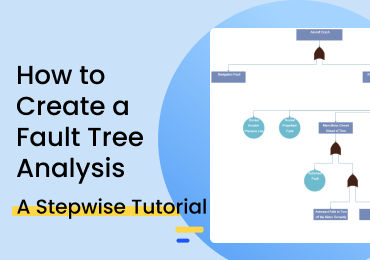
HOW-TO & TIPS
5 Minutes
Fault tree analysis is a visual tool for performing a system-level risk assessment. Learn how to create a fault tree analysis right now.
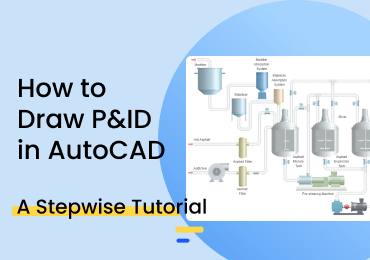
HOW-TO & TIPS
5 Minutes
P&ID diagrams are a critical part of the documentation of industrial setups. They support the design, planning, and maintenance of systems. Read the article and learn how to create P&ID in AutoCAD.

HOW-TO & TIPS
5 Minutes
This article talks about the different ways and tips on how to create your blueprint from scratch. It is complete with a step-by-step guide to making your blueprint easy to draw.
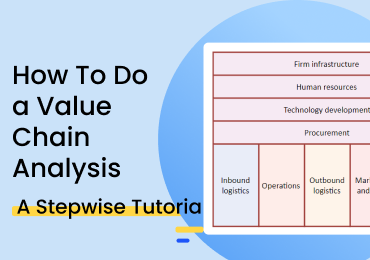
HOW-TO & TIPS
5 Minutes
How to do a value chain analysis? Value chain analysis is the process of identifying the activities that add value to a company's final product or service. It also analyses these activities to underst
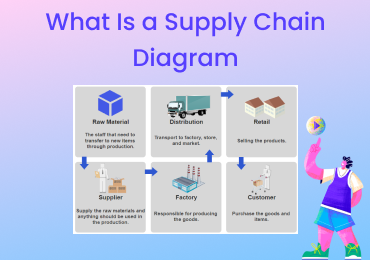
DISCOVERY
5 Minutes
Do you want to know what is a supply chain model and how does it work? Read on and get to know about every vital detail related to a supply chain diagram.
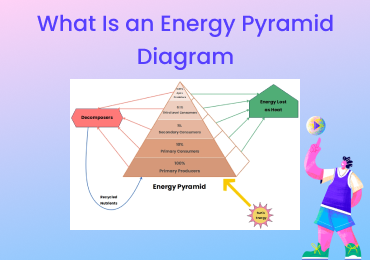
DISCOVERY
5 Minutes
Do you want to know more about the Energy Pyramid and how it works? Read this detailed post on the Energy Pyramid Diagram and learn how to create one.
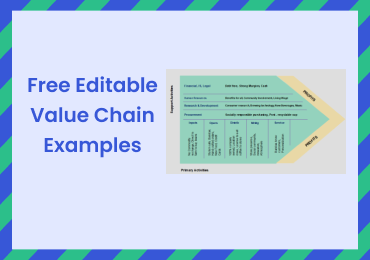
EXAMPLES & TEMPLATES
5 Minutes
A value chain is a diagram that depicts the entire process of creating a product or providing a service. Read this article and get free editable value chain diagram examples.

DISCOVERY
5 Minutes
Value chain vs. supply chain explained with examples. The value chain is aimed at giving companies a competitive advantage in the market. In comparison, the supply chain is focused on overall customer

DISCOVERY
5 Minutes
Unveil the secrets behind the Brand Value Chain with this article from our research team and grow your knowledge in one of the hottest topics of the moment.

DISCOVERY
5 Minutes
Unveil the Healthcare Value Chain and grow your business and commercial strategy knowledge with this outstanding article from our research team.
EXAMPLES & TEMPLATES
5 Minutes
A blank timeline template is a simple but effective tool to ensure every stage of progress is working as per planning. Read this article and get free and editable blank timeline templates.
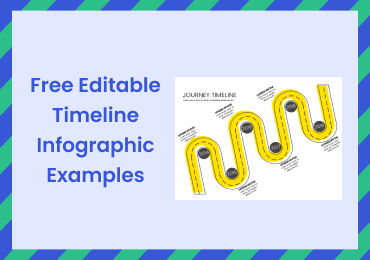
EXAMPLES & TEMPLATES
5 Minutes
Want to present chronological events easily? Well, there are timeline infographics to help you with that. Besides, the best online infographic maker is there to help you. Here are some free editable t
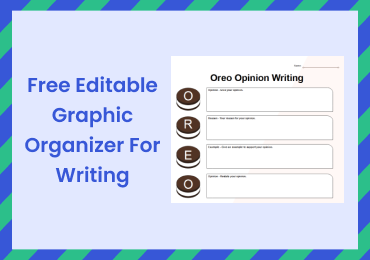
EXAMPLES & TEMPLATES
5 Minutes
A graphic organizer for writing is a teaching and learning tool used for creative writing, comprehension, and literary activities.
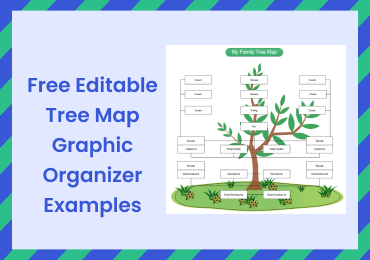
EXAMPLES & TEMPLATES
5 Minutes
Tree map templates are graphic organizers that show the relationship between elements, hierarchy, or trajectory from a component to another to form a trail.

DISCOVERY
5 Minutes
Go deep into Zara’s successful business model through Zara Value Chain Analysis and grow your knowledge on commercial strategies.
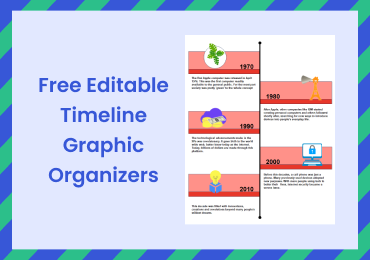
EXAMPLES & TEMPLATES
5 Minutes
A timeline graphic organizer helps in illustrating chronological events visually. Each event is characterized by its start date, the event's name, and the end date.

DISCOVERY
5 Minutes
With an automotive value chain, you can have an overall view of the key components that can make your company flourish. This article goes through the essential points of a value chain analysis that wi

DISCOVERY
5 Minutes
Grow in knowledge about technology, business, and commercial strategies with this interesting insight about the E-commerce Value Chain.
DISCOVERY
5 Minutes
Analyze your value chains effectively with clear and concise diagraming. Get the well-designed pre-built illustrations and diagrams online and build your pharmaceutical value chain.

DISCOVERY
5 Minutes
The effectiveness of an agricultural value chain depends not only on specified strategies but also on how they are presented.

HOW-TO & TIPS
5 Minutes
If you are going to wire your house then this article will help you a lot but for that, you have read it completely. Through this article, you will get all knowledge about house wiring.

DISCOVERY
5 Minutes
Parabolic curve is a graphical representation to understand the correlation between two factors. In this article, it discusses what is parabolic curve, and how to make it online with ease!

DISCOVERY
5 Minutes
The hasse diagram shows the relationship between ordered sets. In this article, it discusses what is hasse diagram, and helps to make hasse diagrams online with ease.

DISCOVERY
5 Minutes
The analytical geometry of Cartesian geometry is based upon the coordinate system. In this article, it discusses what is analytic geometry, and helps to make it online with ease!
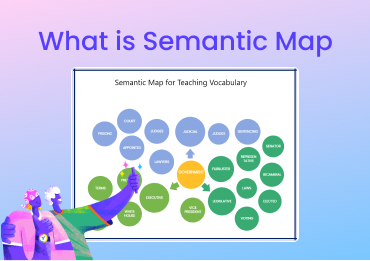
DISCOVERY
5 Minutes
Semantic maps are a powerful educational tool. To make students acquainted with new words and vocabulary, semantic mapping is an effective option.

EXAMPLES & TEMPLATES
5 Minutes
Want to engage more easily with study participants or want to highlight the social context of relationships? Well, what better ways are there than an effective ecomap? Here are some ecomap examples.
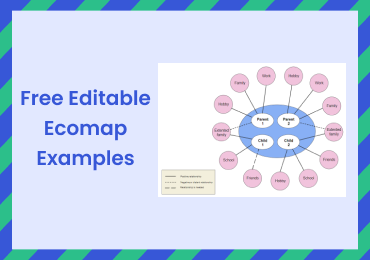
DISCOVERY
5 Minutes
Ecomap provides useful information about an individual and his or her connections to the external world. Here are all the things you need to know about ecomaps- what it is, the symbols and so on.
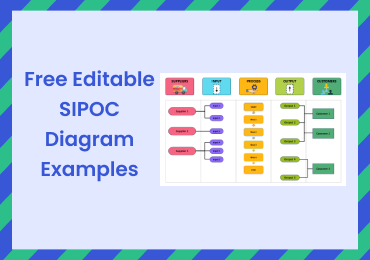
EXAMPLES & TEMPLATES
5 Minutes
SIPOC diagram allows converting a complex project into a simple document and is typically used in the Measure phase of the Six Sigma DMAIC methodology. Here are some Free SIPOC templates.
DISCOVERY
5 Minutes
Nike's value chain analysis shows the primary and secondary activities employed by the company to become the world leader in sportswear and related products.

DISCOVERY
5 Minutes
There are multiple planetary systems present in the universe, and the one which has the sun as its center is known as the solar system. In this article, it discusses solar system definition and how to

DISCOVERY
5 Minutes
An eclipse is a significant event for scientists as they get a chance to know about the sun's corona or regions. In this article, it discusses what is solar eclipse, and how to make solar eclipse diag

DISCOVERY
5 Minutes
The earth revolves around the sun in its orbit. At the same time, the moon is revolving around the earth. In this article, it discusses what is moon phases, and how to make moon phases diagram online.
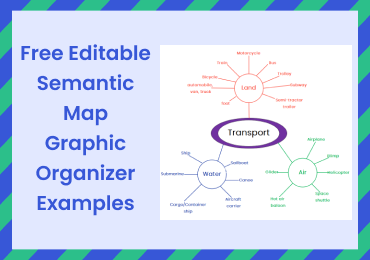
EXAMPLES & TEMPLATES
5 Minutes
Semantic map templates connect the information related to a concept for making it easier for students to understand the concept. Read the article and learn more free semantic map examples.
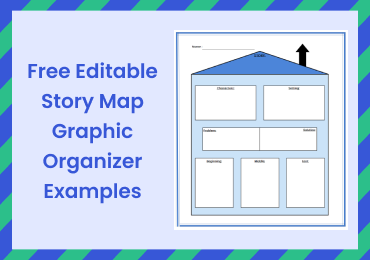
EXAMPLES & TEMPLATES
5 Minutes
Story map graphic organizers help teachers to support students with reading comprehension, connection making, characterization, and understanding of stories.
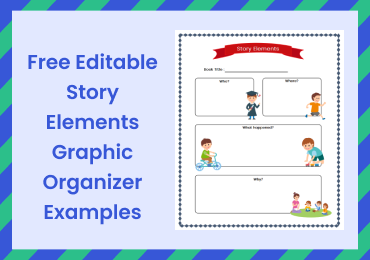
EXAMPLES & TEMPLATES
5 Minutes
Story elements graphic organizers are visual tools to help students and teachers to make reading comprehension stress free. Read the article and get free editable story element graphic organizer examp
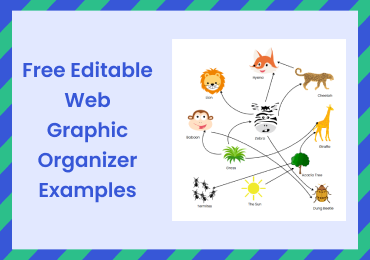
EXAMPLES & TEMPLATES
5 Minutes
Free editable web graphic organizers are visual diagrams that help present and understand problems, idea generation, and brainstorming. There are some free editable web graphic organizer examples.
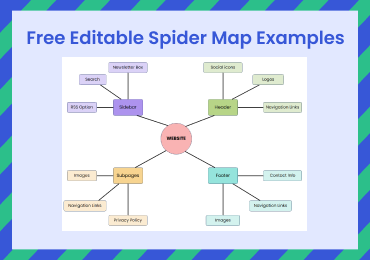
EXAMPLES & TEMPLATES
5 Minutes
Spider map is a graphical tool for brainstorming, organization and categorization of ideas and solutions. Read the article and get free editable spider map examples.
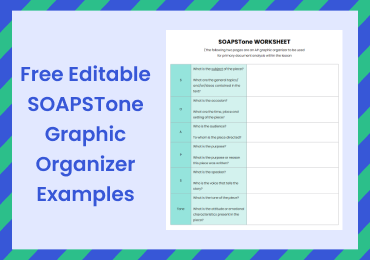
EXAMPLES & TEMPLATES
5 Minutes
SOAPSTone Graphic Organizer is an example of analytic rubric that evaluates a literature piece. It is used for both educational purposes and evaluating literature works. Here are some editable example
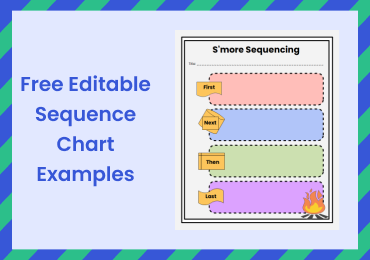
EXAMPLES & TEMPLATES
5 Minutes
The complexity of information lies within the number of data in it. However, sequence charts can make things easy with the proper flow and direction of the events. Here are some examples for free use.
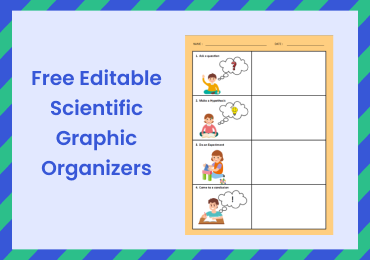
EXAMPLES & TEMPLATES
5 Minutes
Are you looking for scientific graphic organizers? Check out this comprehensive guide to learn about this diagram, and get the editable scientific graphic organizers examples for free!
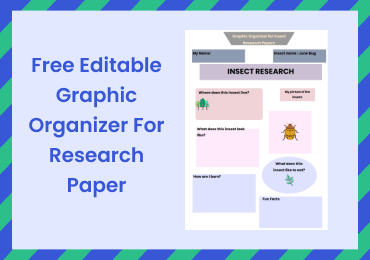
EXAMPLES & TEMPLATES
5 Minutes
Looking to come up with a graphic organizer for research papers? Check out this comprehensive guide, and find out how you can use EdrawMax Online to come up with professional-looking graphic organizer
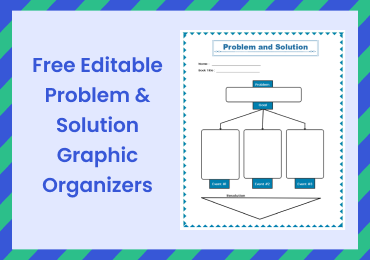
EXAMPLES & TEMPLATES
5 Minutes
Are you looking to make a professional Problem and Solution Graphic Organizer? Click here to learn the basics of these organizers along with some examples. Make one of yours now on EdrawMax Online!
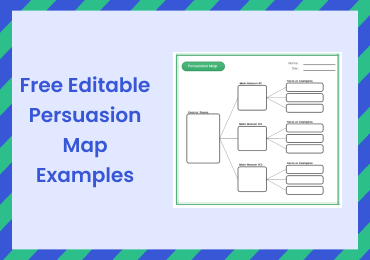
EXAMPLES & TEMPLATES
5 Minutes
Are you looking to create an awesome persuasion map? Check out this comprehensive guide to learn about persuasive cartography, and get the editable persuasion map examples for free!
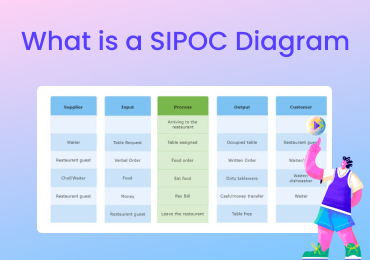
DISCOVERY
5 Minutes
Do you want to come up with a SIPOC map, but don’t know the basics? Learn what is a SIPOC diagram with other vital details in this informative guide.

DISCOVERY
5 Minutes
The service value chain analysis aims to align the service industry with the highest standards of customer experience. This post introduces the service value chain analysis in details.
EXAMPLES & TEMPLATES
5 Minutes
Narrative writing graphic organizers support teachers, parents, and students for tension-free creative writing. These tools present fun solutions for making creative writing stress-free.
HOW-TO & TIPS
5 Minutes
This article will teach you how to read and draw a circuit diagram with examples and video.

DISCOVERY
5 Minutes
Stomata participate in the gaseous exchange and oxygen, carbon dioxide, and diffusion of water vapor. In this article, it not only discusses the stomata knowledge, but helps to make stomata diagram on

DISCOVERY
5 Minutes
Plants mainly have eukaryotic cells surrounded by cell walls. Plant cells also have a nucleus and several other organelles. In this article, it not only discusses the plant cell knowledge, but helps t

DISCOVERY
5 Minutes
Flowers are an essential part of a tree, helping them continue their generations with the fertilization process. In this article, it discusses the parts of a flower, and helps to create flower diagram

DISCOVERY
5 Minutes
The Earth rotates around the sun and also revolves on its axis. In this article, it discusses the earth revolution and earth rotation, and helps you to make earth revolution diagram online with ease!

DISCOVERY
5 Minutes
Plants are a very significant part of nature. In this article, it discusses the parts of a plant and their functions. Then, here is a guide to help you make a plant diagram online with ease!
HOW-TO & TIPS
5 Minutes
In this guide, you will learn some basics about ecomaps and how to draw ecomaps quickly.
HOW-TO & TIPS
5 Minutes
In this guide, you will learn some basics about reflected ceiling plans and how to draw a reflected ceiling plan quickly.
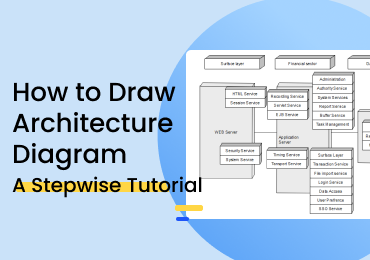
HOW-TO & TIPS
5 Minutes
In this guide, you will learn some basics about architecture diagrams and how to draw architecture diagram quickly.
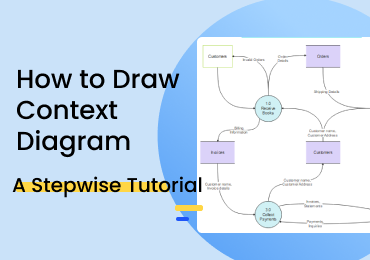
HOW-TO & TIPS
5 Minutes
In this guide, you will learn some basics about context diagrams and how to draw context diagrams quickly.

DISCOVERY
5 Minutes
Netflix value chain analysis is a great way to learn about a different business model solely based on digital media without brick-and-mortar stores or service centers.
DISCOVERY
5 Minutes
Coca Cola value chain analysis is complex because of its local setups globally. Porter's model provides a base for analysis of activities that can help the company gain a competitive advantage.

DISCOVERY
5 Minutes
With a giant restaurant company like McDonald’s, analyzing the whole procedure- including the primary activities and the support activities, is very important. It helps the company evaluate its market

DISCOVERY
5 Minutes
With a giant company like Apple, it is always important to analyze the whole procedure- including the primary activities and the support activities. Here, you will learn about Apple value chain analys
DISCOVERY
5 Minutes
Break down Walmart’s success with value chain analysis and use it to support your business strategy.

DISCOVERY
5 Minutes
Amazon’s value chain analysis is a technique that depicts the primary and support activities that work together to add value to operations for a bigger profit and a competitive advantage.
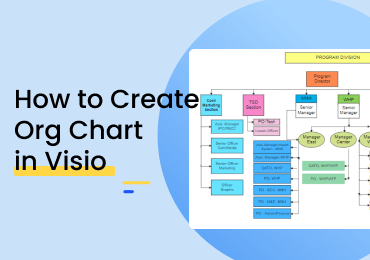
HOW-TO & TIPS
5 Minutes
Present your figures, data, and other information clearly and effectively by using organizational charts. This article will walk you through how to create org chart in Visio and how to create org char
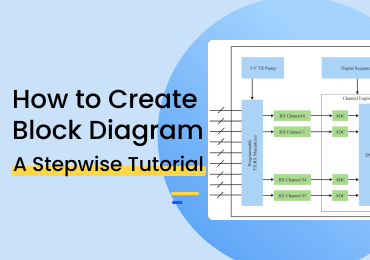
HOW-TO & TIPS
5 Minutes
What is a block diagram and how to make a block diagram online? A block diagram is a high level view that uses blocks, relationships and connections to show how the system will operate.
DISCOVERY
5 Minutes
Do you want to come up with stunning BPMN diagrams, but don’t know about its basics? Read on to know about all the BPMN symbols and their meaning in this post.
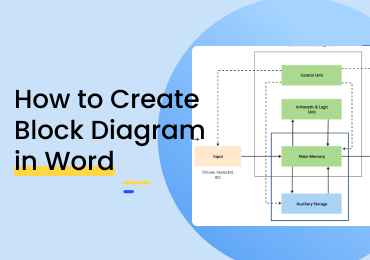
HOW-TO & TIPS
5 Minutes
How to create block diagram in Word? Check this guide to find an easier way to create a block diagrams. Use EdrawMax Online to make professional block diagrams in minutes.
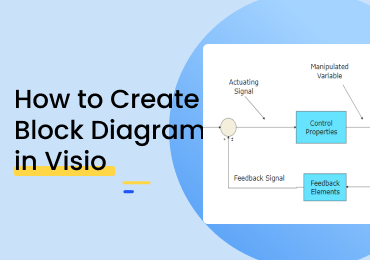
HOW-TO & TIPS
5 Minutes
Looking for tips on how to create better-quality and trouble-free block diagrams? Check out our guide and learn more on how to make block diagrams in Visio and Online.

DISCOVERY
5 Minutes
Seed diagrams can help a student to learn about the germination process and seed anatomy. The students can make a seed diagram by hand, but it is pretty challenging. They must use the EdrawMax Online
DISCOVERY
5 Minutes
The students need to study Mucor and their anatomy to learn about this particular species and the infections caused by them. To learn about them, the students can use a good-quality Mucor diagram. The

DISCOVERY
5 Minutes
The students can quickly learn about honeybees with the help of honeybee anatomy diagrams. It is a complex process, and it is tough to create a honeybee anatomy diagram by hand. The students must take

DISCOVERY
5 Minutes
A food web can help a student understand the food habits of the animals present in an ecosystem. It is tough to create a food web diagram by hand, and hence the students must use the EdrawMax to make

DISCOVERY
5 Minutes
In this article, there is a detailed bird anatomy and a guide to help you make bird anatomy online. Just check this article and use EdrawMax online to create your diagram with ease!

DISCOVERY
5 Minutes
Tesla's value chain analysis shows the primary activities and support activities that the company conducts to gain a competitive advantage over other companies in the market.

DISCOVERY
5 Minutes
Do you want to know how Starbucks works and why it is so profitable? Then read this detailed Starbucks value chain analysis, covering its primary and support activities.
DISCOVERY
5 Minutes
Electrical symbols and electronic circuit symbols are symbols that are used for drawings schematic diagrams. This article explains electrical symbols and meanings in details.

DISCOVERY
5 Minutes
Do you want to depict the flow of data in a system, but can’t find the right model? Get to know about all the major data flow diagram symbols and meaning here.

DISCOVERY
5 Minutes
The whole life cycle has four separate stages with different features. In this article, here discuss the life cycle of a butterfly, and how to create a life cycle of a butterfly diagram with ease.

DISCOVERY
5 Minutes
Learning the leaf structure helps to understand the transportation, transpiration, and photosynthesis mechanism. In this article, here discuss the leaf cross section, and how to create it with ease!

DISCOVERY
5 Minutes
The fish anatomy shows functions of the different organs. In this article, here discuss the fish anatomy, and how to create a kidney diagram with ease.

DISCOVERY
5 Minutes
The animal cells perform different roles in the human body, which play a crucial role in those bodily functions. In this article, here discuss the animal cell, and how to create animal cells online wi

DISCOVERY
5 Minutes
The egg is a wholesome food item. In this article, here discuss the chicken egg, and how to create a chicken egg diagram with ease.

DISCOVERY
5 Minutes
Do you want to come up with a flowchart, but don’t know the meaning of its symbols? Here is a detailed guide on flowchart symbols to clear your doubts.
DISCOVERY
5 Minutes
Do you want to create visually appealing Entity-relationship diagrams, but don’t know how to start? Here are all the basic ER diagram symbols guide you should know.
EXAMPLES & TEMPLATES
5 Minutes
How to make a ER diagram in Visio? Check this guide for making ER diagram in Visio and even easier way. Use EdrawMax Online to create your ER diagram in minutes now!

DISCOVERY
5 Minutes
The shoulder joint is an active joint that assists the forward and backward movement of the shoulder. In this article, here illustrates the shoulder anatomy, and how to create a shoulder joint diagram
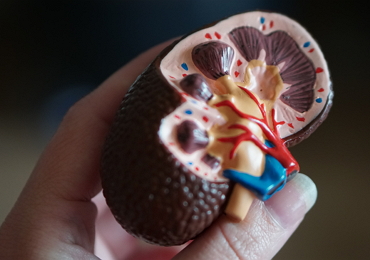
DISCOVERY
5 Minutes
The kidney is the most significant part of the human excretory system. In this article, here discuss the kidney anatomy, and how to create a kidney diagram with ease.

DISCOVERY
5 Minutes
The elbow joint is one of the crucial joints regulating the movement of arms. From this article, here illustrates not only the elbow anatomy, but how to make elbow diagram with ease.

DISCOVERY
5 Minutes
For learning about the human body, it is essential to develop clear ideas about the digestive system. From this article, it illustrates the human digestion system, as well as how to create a digestion
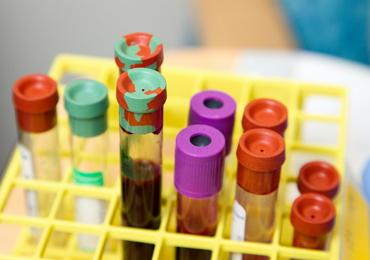
DISCOVERY
5 Minutes
Blood is the connective tissue that helps the human body to get its required nutrients and oxygen. In this article, it not only illustrate the anatomy of blood, but guide readers how to create blood d

DISCOVERY
5 Minutes
IDEF helps to model the decisions, behavior and activities of an organization or system. In this article, it illustrates what is IDEF, its usage and classification, and how to make it in EdrawMax with

DISCOVERY
5 Minutes
The tuning fork resonance experiment can help to show the phenomenon of amplification of sound. Use EdrawMax to create tuning fork resonance experiment diagram and more diagrams with ease now!

DISCOVERY
5 Minutes
Teeth play a vital role in the human body. A tooth anatomy is beneficial for learning about human tooth structure, and you can use EdrawMax Online to create your tooth diagram with ease now!

DISCOVERY
5 Minutes
Neurons are a significant part of the nervous system. They work as a communicator between the brain and the body. Use EdrawMax Online to create neuron labeled with ease.

DISCOVERY
5 Minutes
The lung is a cone-shaped organ present in the chest cavity, helping in the gaseous exchange in the human body, use EdrawMax Online to draw the science diagrams with ease now.

DISCOVERY
5 Minutes
The knee is the largest joint, and its primary function is helping in mobility. Use EdrawMax Online to draw the science diagrams with ease now.
EXAMPLES & TEMPLATES
5 Minutes
You can check out the variety of five forces diagram examples, which help you to visualize and design process. Plus, try EdrawMax Online to create your five forces diagram with ease!
EXAMPLES & TEMPLATES
5 Minutes
You can check out the variety of affinity diagram examples, which help you to visualize the workflow and process. Plus, try EdrawMax Online to create your affinity diagram with ease!
EXAMPLES & TEMPLATES
5 Minutes
You can check out the variety of organizational chart examples, which help you to visualize the hierarchical structure. Plus, try EdrawMax Online to create your organizational chart with ease!
EXAMPLES & TEMPLATES
5 Minutes
You can check out the variety of life mapping examples, which help you to visualize someone's life path. Plus, try EdrawMax Online to create your life map with ease!
EXAMPLES & TEMPLATES
5 Minutes
You can check out the variety of funnel chart examples, which help you to visualize the business stages. Plus, try EdrawMax Online to create your funnel chart with ease!
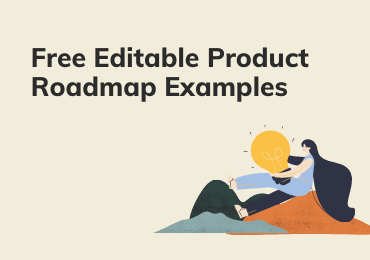
EXAMPLES & TEMPLATES
5 Minutes
You can check out the variety of product roadmaps examples, which help you to visualize and design process. Plus, try EdrawMax Online to create your product roadmap with ease!

EXAMPLES & TEMPLATES
5 Minutes
You can check out the variety of business process modeling techniques examples, which help you to visulize your business processes. Plus, try EdrawMax Online to create your diagrams with ease now!

EXAMPLES & TEMPLATES
5 Minutes
You can check out the variety of block diagram examples, which help you to visualize the network structure. Plus, try EdrawMax Online to create your block diagram with ease!

EXAMPLES & TEMPLATES
5 Minutes
You can check out the variety of agenda examples, which help you to manage the meetings and keep process smoothy. Plus, try EdrawMax Online to create your agenda with ease!
EXAMPLES & TEMPLATES
5 Minutes
You can check out the variety of taxonomy examples, which help you to visualize the hierarchy order. Plus, try EdrawMax Online to create your taxonomy with ease!
EXAMPLES & TEMPLATES
5 Minutes
You can check out the variety of dichotomous key examples, which help you to visualize the classfication of biology. Plus, try EdrawMax Online to create your dichotomous key with ease!
EXAMPLES & TEMPLATES
5 Minutes
You can check out the variety of sociogram examples, which help you to visualize and design relationships. Plus, try EdrawMax Online to create your sociogram with ease!
EXAMPLES & TEMPLATES
5 Minutes
You can check out the variety of SDL diagram examples, which help you to visualize and design process. Plus, try EdrawMax Online to create your SDL diagram with ease!
EXAMPLES & TEMPLATES
5 Minutes
You can check out the variety of laboratory drawings examples, which inspire you to make your own lab drawings. Plus, try EdrawMax Online to create your lab drawing and 280+ types of diagrams with eas
EXAMPLES & TEMPLATES
5 Minutes
You can check out the variety of floor plan examples, which inspire you to create a beautiful house plan. Plus, try EdrawMax Online to create your floor plan with ease.

EXAMPLES & TEMPLATES
5 Minutes
Biology is a practical-based subject that requires visual diagrams and images to understand those mechanisms' structures and functions. There are several types of biology diagrams that make both teach

DISCOVERY
5 Minutes
The ankle joint is a hinge joint and plays a crucial role in the movement. To understand its structure and functions further, you can make an ankle joint drawing in EdrawMax with ease now!
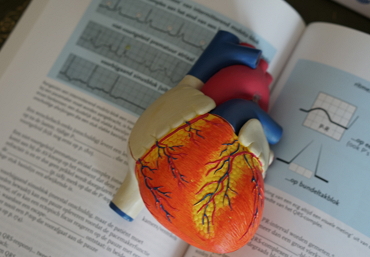
DISCOVERY
5 Minutes
The cardiovascular system is a complex system that controls the blood flow. Arteries and veins are the main parts of the system, use EdrawMax Online to draw the science diagrams with ease now.
EXAMPLES & TEMPLATES
5 Minutes
You can check out the variety of apartment blueprints examples, which inspire you to create a beautiful apartment plan. Plus, try EdrawMax Online to create your blueprints with ease.
EXAMPLES & TEMPLATES
5 Minutes
You can check out the variety of fault tree diagram examples, which help you to analyse reasons of faults. Plus, try EdrawMax Online to create your fault tree diagram with ease.

DISCOVERY
5 Minutes
Check this Restaurant Industry PESTEL analysis to learn its political, ecological, social, technological, economic and legal factors. Also, try EdrawMax Online to create your PESTEL diagrams with ease

DISCOVERY
5 Minutes
Check this Under Armour PESTEL analysis to learn its political, ecological, social, technological, economic and legal factors. Also, try EdrawMax Online to create your PESTEL diagrams with ease.

DISCOVERY
5 Minutes
Check this Tesla PESTEL analysis to learn its political, ecological, social, technological, economic and legal factors. Also, try EdrawMax Online to create your PESTEL diagrams with ease.

DISCOVERY
5 Minutes
Check this Starbucks PESTEL analysis to learn its political, ecological, social, technological, economic and legal factors. Also, try EdrawMax Online to create your PESTEL diagrams with ease.

DISCOVERY
5 Minutes
Check this Haiti PESTEL analysis to learn its political, ecological, social, technological, economic and legal factors. Also, try EdrawMax Online to create your PESTEL diagrams with ease.
DISCOVERY
5 Minutes
Check this Wiki PESTEL analysis to learn its political, ecological, social, technological, economic and legal factors. Also, try EdrawMax Online to create your PESTEL diagrams with ease.

DISCOVERY
5 Minutes
Check this Pharmaceutical Industry PESTEL analysis to learn its political, ecological, social, technological, economic and legal factors. Also, try EdrawMax Online to create your PESTEL diagrams with

DISCOVERY
5 Minutes
Check this Nike PESTEL analysis to learn its political, ecological, social, technological, economic and legal factors. Also, try EdrawMax Online to create your PESTEL diagrams with ease.

DISCOVERY
5 Minutes
Check this India PESTEL analysis to learn its political, ecological, social, technological, economic and legal factors. Also, try EdrawMax Online to create your PESTEL diagrams with ease.

DISCOVERY
5 Minutes
Check this Coca Cola PESTEL analysis to learn its political, ecological, social, technological, economic and legal factors. Also, try EdrawMax Online to create your PESTEL diagrams with ease.
DISCOVERY
5 Minutes
Check this Automobile Industry PESTEL analysis to learn its political, ecological, social, technological, economic and legal factors. Also, try EdrawMax Online to create your PESTEL diagrams with ease

DISCOVERY
5 Minutes
Check this IKEA PESTEL analysis to learn its political, ecological, social, technological, economic and legal factors. Also, try EdrawMax Online to create your PESTEL diagrams with ease.

DISCOVERY
5 Minutes
Check this China PESTEL analysis to learn its political, ecological, social, technological, economic and legal factors. Also, try EdrawMax Online to create your PESTEL diagrams with ease.

DISCOVERY
5 Minutes
Check this Airline Industry PESTEL analysis to learn its political, ecological, social, technological, economic and legal factors. Also, try EdrawMax Online to create your PESTEL diagrams with ease.

DISCOVERY
5 Minutes
Check this Netflix PESTEL analysis to learn its political, ecological, social, technological, economic and legal factors. Also, try EdrawMax Online to create your PESTEL diagrams with ease.

DISCOVERY
5 Minutes
Check this Google PESTEL analysis to learn its political, ecological, social, technological, economic and legal factors. Also, try EdrawMax Online to create your PESTEL diagrams with ease.

DISCOVERY
5 Minutes
Check this Disney PESTEL analysis to learn its political, ecological, social, technological, economic and legal factors. Also, try EdrawMax Online to create your PESTEL diagrams with ease.
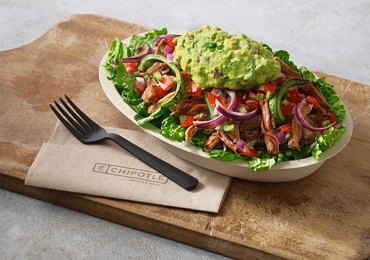
DISCOVERY
5 Minutes
Check this Chipotle PESTEL analysis to learn its political, ecological, social, technological, economic and legal factors. Also, try EdrawMax Online to create your PESTEL diagrams with ease.

DISCOVERY
5 Minutes
Check this Apple PESTEL analysis to learn its political, ecological, social, technological, economic and legal factors. Also, try EdrawMax Online to create your PESTEL diagrams with ease.
EXAMPLES & TEMPLATES
5 Minutes
You can check out the variety of circular flow diagram examples, which help you to visualize and design space. Plus, try EdrawMax Online to create your circular flow diagram with ease!

EXAMPLES & TEMPLATES
5 Minutes
You can check out the variety of aws architecture diagram examples, which help you to visualize and optimize network system. Plus, try EdrawMax Online to create your aws architecture diagram with ease

DISCOVERY
5 Minutes
Check this Amazon PESTEL analysis to learn its political, ecological, social, technological, economic and legal factors. Also, try EdrawMax Online to create your PESTEL diagrams with ease.
EXAMPLES & TEMPLATES
5 Minutes
You can check out the variety of P&ID examples, which help you to visualize and optimize industrial processes. Plus, try EdrawMax Online to create your P&ID with ease!
EXAMPLES & TEMPLATES
5 Minutes
You can check out the variety of BPMN examples, which help you to visualize and develop business processes. Plus, try EdrawMax Online to create your BPMN with ease!
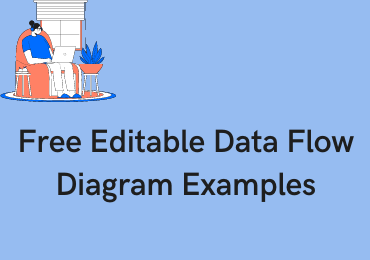
EXAMPLES & TEMPLATES
5 Minutes
You can check out the variety of data flow diagram examples, which help you to visualize data and system. Plus, try EdrawMax Online to create your data flow diagram with ease!
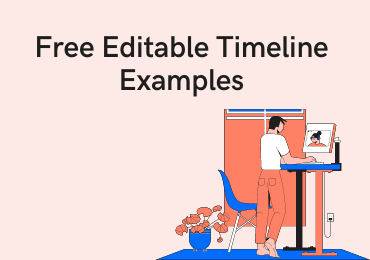
EXAMPLES & TEMPLATES
5 Minutes
You can check out the variety of timeline examples, which help you to visualize and record milestones. Plus, try EdrawMax Online to create your timelines with ease!
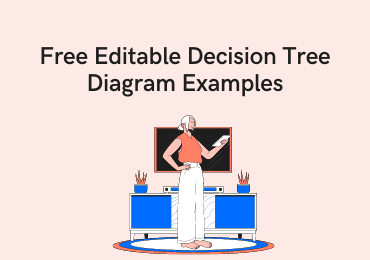
EXAMPLES & TEMPLATES
5 Minutes
You can check out the variety of decision tree diagram examples, which help you to analyze conditions and make decisions. Plus, try EdrawMax Online to create your decision tree with ease now!
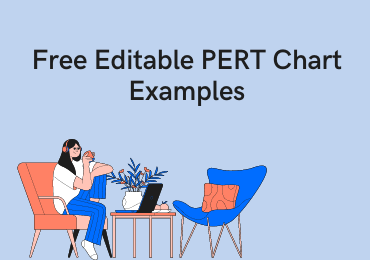
EXAMPLES & TEMPLATES
5 Minutes
You can check out the variety of PERT chart examples, which help you to visualize and manage projects. Plus, try EdrawMax Online to create your PERT charts with ease!
EXAMPLES & TEMPLATES
5 Minutes
You can check out the variety of concept map examples, which help you to visualize and manage your ideas. Plus, try EdrawMax Online to create your concept maps with ease!
EXAMPLES & TEMPLATES
5 Minutes
The Scatter plot is a type of chart that helps in data visualization. One can use the Cartesian coordinates to create a mathematical diagram or scatter plot. The basic rule of reading a scatter plot e
HOW-TO & TIPS
5 Minutes
How to make an invoice in Excel? Check this guide for making invoice in Excel and even easier way. Use EdrawMax Online to create your invoice in minutes now!
HOW-TO & TIPS
5 Minutes
How to make an invoice in Word? Check this guide for making invoice in Word and even easier way. Use EdrawMax Online to create your invoice in minutes now!
HOW-TO & TIPS
5 Minutes
How to make a PERT chart in Word? Check this guide for making PERT chart in Word and even easier way. Use EdrawMax Online to create your PERT chart in minutes now!
HOW-TO & TIPS
5 Minutes
How to make a matrix in Excel? Check this guide for making matrix in Excel and even easier way. Use EdrawMax Online to create your matrix in minutes now!
HOW-TO & TIPS
5 Minutes
How to make a calendar in Google Sheets? Check this guide for making calendar in Google Sheets and even easier way. Use EdrawMax Online to create your calendar in minutes now!

HOW-TO & TIPS
5 Minutes
How to make a matrix in Word? Check this guide for making matrix in Word and even easier way. Use EdrawMax Online to create your matrix in minutes now!
HOW-TO & TIPS
5 Minutes
How to make a calendar in Outlook? Check this guide for making calendar in Outlook and even easier way. Use EdrawMax Online to create your calendar in minutes now!

HOW-TO & TIPS
5 Minutes
How to make a calendar in word? Check this guide for making calendar in word and even easier way. Use EdrawMax Online to create your calendar in minutes now!
HOW-TO & TIPS
5 Minutes
How to make a calendar in Excel? Check this guide for making calendar in Excel and even easier way. Use EdrawMax Online to create your calendar in minutes now!
HOW-TO & TIPS
5 Minutes
How to make a checklist in Google Sheets? Check this guide for making checklist in Google Sheets and even easier way. Use EdrawMax Online to create your checklist in minutes now!

HOW-TO & TIPS
5 Minutes
How to make a checklist in Google Docs? Check this guide for making checklist in Google Docs and even easier way. Use EdrawMax Online to create your checklist in minutes now!

HOW-TO & TIPS
5 Minutes
How to make a checklist in Word? Check this guide for making checklist in Word and even easier way. Use EdrawMax Online to create your checklist in minutes now!
HOW-TO & TIPS
5 Minutes
How to make a bubble map on Google Docs? Check this guide for making bubble map on Google Docs and even easier way. Use EdrawMax Online to create your bubble map in minutes now!
HOW-TO & TIPS
5 Minutes
How to make a pyramid diagram in PowerPoint? Check this guide for making pyramid diagram in PowerPoint and even easier way. Use EdrawMax Online to create your pyramid diagram in minutes now!
HOW-TO & TIPS
5 Minutes
How to make a concept map on Google Docs? Check this guide for making concept map on Google Docs and even easier way. Use EdrawMax Online to create your concept map in minutes now!
HOW-TO & TIPS
5 Minutes
How to make a funnel chart in PowerPoint? Check this guide for making funnel chart in PowerPoint and even easier way. Use EdrawMax Online to create your funnel chart in minutes now!

HOW-TO & TIPS
5 Minutes
How to make a decision tree in Visio? Check this guide for making decision tree in Visio and even easier way. Use EdrawMax Online to create your decision tree in minutes now!
HOW-TO & TIPS
5 Minutes
How to make a BPMN in Visio? Check this guide for making BPMN in Visio and even easier way. Use EdrawMax Online to create your BPMN in minutes now!
HOW-TO & TIPS
5 Minutes
How to make a BPMN in PowerPoint? Check this guide for making BPMN in PowerPoint and even easier way. Use EdrawMax Online to create your BPMN in minutes now!

HOW-TO & TIPS
5 Minutes
How to make a fault tree analysis in excel? Check this guide for making fault tree analysis in excel and even easier way. Use EdrawMax Online to create your fault tree analysis in minutes now!
HOW-TO & TIPS
5 Minutes
How to make a Thank You card in PowerPoint? Check this guide for making Thank You in PowerPoint and even easier way. Use EdrawMax Online to create your Thank You card in minutes now!

HOW-TO & TIPS
5 Minutes
How to make a Thank You card in Word? Check this guide for making Thank You in Word and even easier way. Use EdrawMax Online to create your Thank You card in minutes now!

HOW-TO & TIPS
5 Minutes
How to make a business card in Photoshop? Check this guide for making business cards in Photoshop and even easier way. Use EdrawMax Online to create your business card in minutes now!

HOW-TO & TIPS
5 Minutes
How to make a business card in Outlook? Check this guide for making business cards in Outlook and even easier way. Use EdrawMax Online to create your business card in minutes now!

HOW-TO & TIPS
5 Minutes
How to make a business card in Word? Check this guide for making business cards in Word and even easier way. Use EdrawMax Online to create your business card in minutes now!

HOW-TO & TIPS
5 Minutes
How to make a network diagram on word? Check this guide for making network diagram on word and even easier way. Use EdrawMax Online to create your network diagram in minutes now!

HOW-TO & TIPS
5 Minutes
How to make a mind map in Google Docs? Check this guide for making mind map in Google Docs and even easier way. Use EdrawMax Online to create your mind map in minutes now!
HOW-TO & TIPS
5 Minutes
How to make a storyboard in Google Slides? Check this guide for making storyboard in Google Slides and even easier way. Use EdrawMax Online to create your Storyboard in minutes now!

HOW-TO & TIPS
5 Minutes
How to make a storyboard in Word? Check this guide for making storyboard in Word and even easier way. Use EdrawMax Online to create your Storyboard in minutes now!
HOW-TO & TIPS
5 Minutes
How to make a storyboard in Photoshop? Check this guide for making storyboard in Photoshop and even easier way. Use EdrawMax Online to create your Storyboard in minutes now!
HOW-TO & TIPS
5 Minutes
How to make a flowchart in Visio? Check this guide for making flowchart in Visio and even easier way. Use EdrawMax Online to create your flowchart in minutes now!

HOW-TO & TIPS
5 Minutes
How to make a genogram on Excel? Check this guide for making genogram on Excel and even easier way. Use EdrawMax Online to create your genogram in minutes now!
HOW-TO & TIPS
5 Minutes
How to make a genogram on PowerPoint? Check this guide for making genogram on PowerPoint and even easier way. Use EdrawMax Online to create your genogram in minutes now!
HOW-TO & TIPS
5 Minutes
How to make a genogram on Word? Check this guide for making genogram on Word and even easier way. Use EdrawMax Online to create your genogram in minutes now!
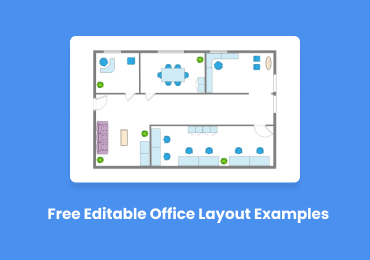
EXAMPLES & TEMPLATES
5 Minutes
You can check out the variety of office layout examples, which help you to visualize and design space. Plus, try EdrawMax Online to create your office layout with ease!
EXAMPLES & TEMPLATES
5 Minutes
You can check out the variety of arrows examples and templates, which help you to understand and visualize ideas. Plus, try EdrawMax Online to create your arrows with ease!
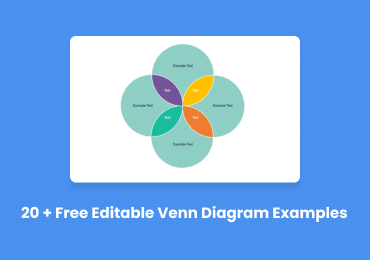
EXAMPLES & TEMPLATES
5 Minutes
You can check out over 20 Venn diagram examples, which help you to understand and visualize relationships. Plus, try EdrawMax Online to create your Venn diagram with ease!
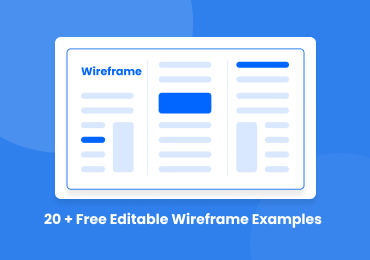
EXAMPLES & TEMPLATES
5 Minutes
You can check out over 20 wireframe examples, which help you to understand and visualize websites. Plus, try EdrawMax Online to create your wireframe with ease!

DISCOVERY
5 Minutes
Check this Microsoft SWOT analysis to learn its strengths, weakness, opportunities, and threats. Also, try EdrawMax Online to create your SWOT diagrams with ease.

DISCOVERY
5 Minutes
Check this Panera Bread SWOT analysis to learn its strengths, weakness, opportunities, and threats. Also, try EdrawMax Online to create your SWOT diagrams with ease.

DISCOVERY
5 Minutes
Check this Southwest Airlines SWOT analysis to learn its strengths, weakness, opportunities, and threats. Also, try EdrawMax Online to create your SWOT diagrams with ease.

DISCOVERY
5 Minutes
Check this Spotify SWOT analysis to learn its strengths, weakness, opportunities, and threats. Also, try EdrawMax Online to create your SWOT diagrams with ease.

DISCOVERY
5 Minutes
Check this IBM SWOT analysis to learn its strengths, weakness, opportunities, and threats. Also, try EdrawMax Online to create your SWOT diagrams with ease.

DISCOVERY
5 Minutes
Check this Toyota SWOT analysis to learn its strengths, weakness, opportunities, and threats. Also, try EdrawMax Online to create your SWOT diagrams with ease.

DISCOVERY
5 Minutes
Check this Wells Fargo SWOT analysis to learn its strengths, weakness, opportunities, and threats. Also, try EdrawMax Online to create your SWOT diagrams with ease.

DISCOVERY
5 Minutes
Check this Whole Foods SWOT analysis to learn its strengths, weakness, opportunities, and threats. Also, try EdrawMax Online to create your SWOT diagrams with ease.

DISCOVERY
5 Minutes
Check this Johnson & Johnson SWOT analysis to learn its strengths, weakness, opportunities, and threats. Also, try EdrawMax Online to create your SWOT diagrams with ease.

DISCOVERY
5 Minutes
Check this Home Depot SWOT analysis to learn its strengths, weakness, opportunities, and threats. Also, try EdrawMax Online to create your SWOT diagrams with ease.

DISCOVERY
5 Minutes
Check this Harley Davidson SWOT analysis to learn its strengths, weakness, opportunities, and threats. Also, try EdrawMax Online to create your SWOT diagrams with ease.

DISCOVERY
5 Minutes
Check this Fitbit SWOT analysis to learn its strengths, weakness, opportunities, and threats. Also, try EdrawMax Online to create your SWOT diagrams with ease.

DISCOVERY
5 Minutes
Check this FedEx SWOT analysis to learn its strengths, weakness, opportunities, and threats. Also, try EdrawMax Online to create your SWOT diagrams with ease.

DISCOVERY
5 Minutes
Check this Dunkin Donuts SWOT analysis to learn its strengths, weakness, opportunities, and threats. Also, try EdrawMax Online to create your SWOT diagrams with ease.

DISCOVERY
5 Minutes
Check this Costco SWOT analysis to learn its strengths, weakness, opportunities, and threats. Also, try EdrawMax Online to create your SWOT diagrams with ease.
DISCOVERY
5 Minutes
Check this Coca Cola SWOT analysis to learn its strengths, weakness, opportunities, and threats. Also, try EdrawMax Online to create your SWOT diagrams with ease.

DISCOVERY
5 Minutes
The Boeing SWOT analysis would help company to make strategic plannings in the future. Use EdrawMax Online to make your SWOT analysis diagram with ease now!

DISCOVERY
5 Minutes
The BMW SWOT analysis can show how BMW works on its weakness and strengths to keep its position intact in a highly competitive market. Use EdrawMax Online to create your SWOT analysis without efforts!

DISCOVERY
5 Minutes
Check this Best Buy SWOT analysis to learn its strengths, weakness, opportunities, and threats. Also, try EdrawMax Online to create your SWOT diagrams with ease.

DISCOVERY
5 Minutes
Airbnb SWOT Analysis can show how Airbnb works on its weakness, strengths, threats and opportunities to keep its position intact in a highly competitive market.

EXAMPLES & TEMPLATES
5 Minutes
Easter cards are the best way to convey your greetings and blessings. EdrawMax Online enables you to create Easter card online, and share without efforts.

DISCOVERY
5 Minutes
As Easter is around the corner, EdrawMax online offers you some Easter decorations ideas, Easter egg, Easter wreath design. Also, you can create your Easter planner to settle these things down easier!
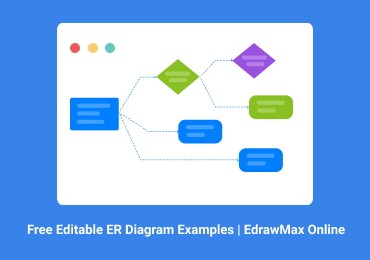
EXAMPLES & TEMPLATES
5 Minutes
You can check out the variety of ERD examples, which help you to understand and visualize database. Plus, try EdrawMax Online to create your ER diagram with ease!
EXAMPLES & TEMPLATES
5 Minutes
If you are looking for the UML deployment diagram examples, then you are in the right place. We provide substantial deployment diagram examples for you, just try EdrawMax Online now!
EXAMPLES & TEMPLATES
5 Minutes
To help you understand how use case diagram work, here are some editable use case diagram examples provided for your reference. Or you can create your diagram in EdrawMax Online without efforts!
EXAMPLES & TEMPLATES
5 Minutes
If you are looking for the UML sequence diagram examples, then you are in the right place. We provide substantial sequence diagram examples for you, just try EdrawMax Online now!
EXAMPLES & TEMPLATES
5 Minutes
The visual representation of video content with various details is called a storyboard. These storyboard examples help you to understand and make storyboard quickly with EdrawMax Online.

EXAMPLES & TEMPLATES
5 Minutes
There are different types of electrical wiring diagrams available, which will help you make wiring diagrams with ease in EdrawMax Online. Just try it free now!
EXAMPLES & TEMPLATES
5 Minutes
The companies use value stream mapping to improve their work process and cut down the wastage. There are free editable values stream mapping examples in EdrawMax Online, just use it now!
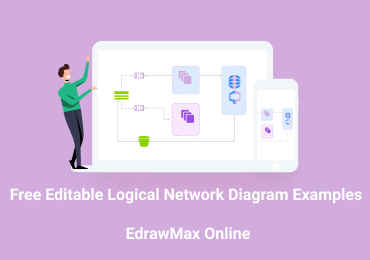
EXAMPLES & TEMPLATES
5 Minutes
Companies may make logical network diagrams to help them analyze the connection and troubleshoot bug. Check these logical network diagram examples to have a clear understanding, and make yours with Ed
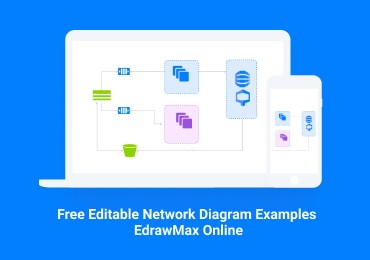
EXAMPLES & TEMPLATES
5 Minutes
There are different sorts of network diagrams available. You can use the network diagram examples to work on their data and modify the content.Just try EdrawMax online now!

EXAMPLES & TEMPLATES
5 Minutes
Check free editable Valentine's Day card examples in EdrawMax Online. Get started creating your card by choosing a built-in love card template and send to your be loved directly. Just try it now!
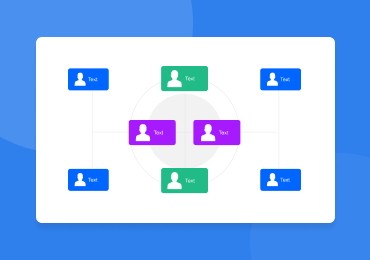
EXAMPLES & TEMPLATES
5 Minutes
Check free editable family tree examples in EdrawMax Online. Get started creating family trees by choosing the built-in family tree template and keep customizing as you like. Just try it now!
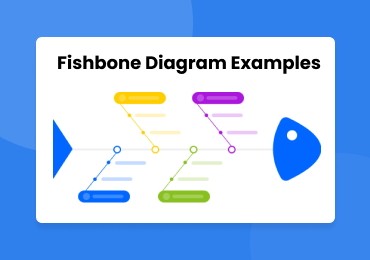
EXAMPLES & TEMPLATES
5 Minutes
Explore these free editable fishbone examples for reference or inspiration, or create your own fishbone diagrams in EdrawMax Online without efforts!
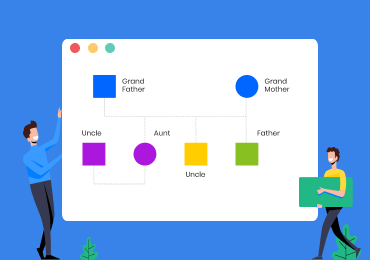
EXAMPLES & TEMPLATES
5 Minutes
Check free editable genogram examples in EdrawMax Online. Get started creating genograms by choosing the built-in genogram template and keep customizing as you like. Just try it now!

HOW-TO & TIPS
5 Minutes
Precedence diagramming method is commonly used to provide an overview of business plans and their activities. This technique is used by project managers to effectively develop business or project stra

DISCOVERY
5 Minutes
Check this McDonald’s SWOT analysis to learn its strengths, weakness, opportunities, and threats. Also, try EdrawMax Online to create your SWOT diagrams with ease.

DISCOVERY
5 Minutes
Chipotle SWOT Analysis helps the company determine its strengths and weaknesses to plan strategically to remove their shortcomings. They can also choose some opportunities to work on while preparing t

DISCOVERY
5 Minutes
Disney SWOT analysis can show how a famous company like Disney uses its strengths to expand and, at the same time, try to eradicate their weaknesses. They also plan correctly to use the opportunities

DISCOVERY
5 Minutes
Google SWOT analysis can show the strengths and weaknesses of the company. It will also hint at the companies' future strategies to help them use opportunities for further expansion.

DISCOVERY
5 Minutes
PepsiCo SWOT analysis can show how the company strategically works on the opportunities and plans its progress to give intense competition to other leading beverage companies.

DISCOVERY
5 Minutes
Starbucks SWOT Analysis can show how the world's largest coffeehouse chain works on its weakness and strengths to keep its position intact in the highly competitive market.

DISCOVERY
5 Minutes
Samsung SWOT analysis will help to diagnose the threats, which will be an obstruction for the progress. Most importantly, a SWOT analysis will help in strategic planning for the future growth of the b

DISCOVERY
5 Minutes
Target SWOT analysis will show how the company uses its strengths and, at the same time, works on its weaknesses to retain its position as the 8th largest retail brand in the United States alone.

DISCOVERY
5 Minutes
Netflix SWOT analysis will help to recognize the weakness and strengths of the brand. It can help them to do strategic planning for future expansion.

DISCOVERY
5 Minutes
The Walmart SWOT analysis can help the company locate the areas they need to improve to hold its position as one of the most trusted companies.

DISCOVERY
5 Minutes
GoPro SWOT analysis can help the brand identify their strengths and weaknesses. As one of the top companies, GoPro works on its weakness while planning strategies to use the opportunities and prepare
DISCOVERY
5 Minutes
Patagonia SWOT analysis show how the company can work on their strengths and weaknesses to improve its performance. From Patagonia SWOT analysis, they can find the opportunities that align with their

DISCOVERY
5 Minutes
Nike SWOT Analysis shows how the improvement of the internal strategic factors that are strengths and weaknesses can help a brand reach global leadership in a competitive market, despite the threats p

DISCOVERY
5 Minutes
Using the Nordstrom SWOT analysis, the company can analyze its current stand in the retail market. They will plan their future steps to progress while securing a robust presence in the retail market s

DISCOVERY
5 Minutes
Setting business strategies based on the Lululemon SWOT analysis will help the brand to have a better position in the current competitive market.

DISCOVERY
5 Minutes
Since many companies are getting into the online retail business, Amazon needs to get a proper SWOT analysis, which can help the company keep its strong position amidst the changing global market scen

DISCOVERY
5 Minutes
Get a comprehensive Uber SWOT Analysis which considers compelling points. Learn about the potential perks and drawbacks associated with Uber through detailed and precise analytics.
DISCOVERY
5 Minutes
UML object diagrams are crucial for visualizing the functionality and relationships between objects in a system. Try EdrawMax to create your object diagrams as simple as possible!
DISCOVERY
5 Minutes
Read on for everything you need to know about UML class diagrams, complete with detailed descriptions, expert tips, and class diagram examples for you to use!
EXAMPLES & TEMPLATES
5 Minutes
Flowcharts are of different kinds and several types of flowchart diagrams are showcased here. Their benefits and uses are illustrated here with examples.

EXAMPLES & TEMPLATES
5 Minutes
Here we look at graphic organizers, how they are used, different forms and software tools that are available for use for teachers, professionals, and students.

EXAMPLES & TEMPLATES
5 Minutes
This article showcases different kinds of org charts, examples of fortune 500 companies and how software applications make it easy for drawing such charts.

HOW-TO & TIPS
5 Minutes
A checklist is a list of items to check as accomplished or observed. It assists in maintaining accuracy and completeness in executing a project. The "to-do list" is a basic example. Creating a checkli

HOW-TO & TIPS
5 Minutes
Flowcharts are an easy way to represent the ideas graphically. One such example is a switch case flowchart that is frequently used in programming languages. Let's head to the article to know how to cr

DISCOVERY
5 Minutes
A package diagram is a pattern for classifying logical elements into sequences. The purpose is to simplify a process or set of instructions into visual UML package diagrams. Elements are grouped into

DISCOVERY
5 Minutes
Component diagram is a systematic way to model your developing software idea into a structure representing its various elements. Check this article to learn more about the component diagram and how to

DISCOVERY
5 Minutes
Collaboration diagrams are designed to simplify complex processes. And create an interaction interface between objects using links, messages, and actors. In UML, a collaboration diagram demonstrates t

DISCOVERY
5 Minutes
A complete and concise guide to interaction overview diagrams. Read on to find out more about what they are and when they should be used, complete with interaction overview diagram examples.

DISCOVERY
5 Minutes
A UML state diagram is commonly used by software developers to map out the behavior of a system. Find out more about when they are used and draw them in this comprehensive guide, complete with detaile

DISCOVERY
5 Minutes
Sometimes the most straightforward diagrams can be the most effective. That is what use case diagrams can offer - a simple representation of interactions between actors and a system. For situations wh

DISCOVERY
5 Minutes
The article gives you an insight into the UML deployment diagram. From the definitions to the components, its uses, and the applications, it gives you all the information in detail. Read to know more

HOW-TO & TIPS
5 Minutes
Birthday cards are a tradition of birthday celebrations. It helps in showing that you care about someone on their special day. Designing a birthday card or greeting online gives you the flexibility to

DISCOVERY
5 Minutes
Scope diagrams are crucial in defining the vision/objective of the business or project. They help in creating a road map towards understanding the outcomes of the project. A scope diagram is the scope

DISCOVERY
5 Minutes
Ford is one of the largest automobile companies in the world. Ford’s SWOT Analysis depicts the main issues the company has to improve upon to dominate the automobile industry. It also illustrates key

HOW-TO & TIPS
5 Minutes
Spider charts, or radar charts, are used to plot one or more sets of values over multiple variables. Read on for a step-by-step instructional guide, complete with a video tutorial, on how to create sp

DISCOVERY
5 Minutes
Adidas Group is leading the sportswear apparel, sporting accessories, and footwear industry with its innovative products. In the SWOT analysis, Adidas's dynamic business model is discussed in-depth to

DISCOVERY
5 Minutes
A tape diagram is a diagram commonly used to solve comparison mathematical problems. The sections of a ratio are divided into rectangles, to help with ratio-based mathematical word problems. These dia
HOW-TO & TIPS
5 Minutes
The accounts payable process has a vast expenditure and purchasing cycle. It contains three steps includes purchase orders, reports of receiving, and vendor payment. Check the guidelines for creating

HOW-TO & TIPS
5 Minutes
A work schedule is a list of employees and their associated information within a given period. Considering the creation of a work schedule, EdrawMax is the easiest tool by choosing a built-in template

DISCOVERY
5 Minutes
What is a communication diagram? Why is it useful for me? How does it differ from a sequence diagram? We answer these questions and more in this handy guide on communication diagrams, complete with pr

DISCOVERY
5 Minutes
The agile release planning is the product management approach which considers the incomprehensible and workable nature of software development.It is highly recommended to use EdrawMax to create your a

DISCOVERY
5 Minutes
A sociogram is a schematic depiction of a person's social relations. In a group setting, it is a graph drawing that charts the structure of human interactions. You may formulate concise descriptions o

DISCOVERY
5 Minutes
A ladder diagram is a type of schematic diagram used in industrial automation, describing circuits for logic control. Two vertical control rails and horizontal logic rungs make up the ladder diagrams

DISCOVERY
5 Minutes
The human eye is an organ that responds to light. It is the gateway to all of our five senses, which allows for the perception of light, awareness of colour and depth perception. The human eye diagram

DISCOVERY
5 Minutes
To understand our customers, customer empathy maps give us a human-centered viewpoint and help us create something that can better satisfy their needs, both physically and emotionally.This map is a wo

DISCOVERY
5 Minutes
The human brain is the central organ of the human nervous system, along with the spinal cord. It consists of the cerebrum, the cerebellum, and the brainstem. EdrawMax helps to create the brain diagram

DISCOVERY
5 Minutes
A pedigree chart shows the presence or absence of a trait or gene through generations within a family. Pedigree charts are used to identify dominant and recessive characteristics.

DISCOVERY
5 Minutes
Kinship charts help in demonstrating relationships, and creating a map to understand lineage and ancestral history. Kinship charts use the same simple markers, to portray persons and social institutio

DISCOVERY
5 Minutes
If you are confused who your ancestors are and where they came from, knowing what is a genogram will help you out. Read the article to fully explore its uses, how to draw it with EdrawMax and how it p

DISCOVERY
5 Minutes
The most important organ of the human body is the human heart. It pumps blood from the heart to the rest of the body. Meanwhile, the heart diagram can help better understand our organ, use EdrawMax to

DISCOVERY
5 Minutes
Modern workspace design is gaining momentum. With the latest technology advancements, these new office design trends are set to transform the traditional working spaces into productive and efficient a

DISCOVERY
5 Minutes
Mechanical diagram is created to demonstrate the mechanical physical operation. For certain types of mechanics structures, they are used to represent the forces and moments applied to an object and to

DISCOVERY
5 Minutes
The affinity diagram is a method for organizing ideas and information. If you have a lot of mixed data, such as statistics, user preferences, customer desires, observations, and design problems, these

DISCOVERY
5 Minutes
Tesla is leading innovative and sustainable approaches in the automobile industry. In the SWOT analysis, Tesla’s dynamic business model is discussed in-depth. Tesla’s clean energy designs and innovati

HOW-TO & TIPS
5 Minutes
Customer journey maps put emphasis on the customer's viewpoint, helping marketers better consider consumer needs and desires.

DISCOVERY
5 Minutes
A consumer journey map is a graphic illustration of all the touchpoints your consumers have, online or offline, with your brand. This helps brands view their products from their consumer’s perspective

DISCOVERY
5 Minutes
A planogram is a diagram that illustrates how and when different retail items will be put in store shelves or displays to improve consumer transactions. They are a store's extensive and accurate conce

DISCOVERY
5 Minutes
Amazon Web Services (AWS) is a cloud network that offers computing, analytics, security tools and more. AWS architecture diagrams allow you to define the operations and deployments of the cloud comput

HOW-TO & TIPS
5 Minutes
Landscape architecture is an art of arranging roads, parks, lawns, shrubs, gardens, flower beds, etc. in order to create a stunning building setting. The primary aim of landscaping is to create a peac

DISCOVERY
5 Minutes
A circular diagram illustrates the internal workings of a financial structure and different parts of the economy making it widely used in a wide variety of presentations. It helps to demonstrate how a

DISCOVERY
5 Minutes
EdrawMax presents a comprehensive, straightforward guide to creating your profile diagrams, complete with a tutorial on how to create your diagrams with ease, as well as detailed examples for you to f
DISCOVERY
5 Minutes
Checklists are a collection/list of items that have been defined to complete a certain process or activity. Checklists are an important way of getting tasks done. They put everything before you, in a

DISCOVERY
5 Minutes
The architecture diagram is a schematic representation of a collection of ideas that are aspects of an architecture including its values, elements, and components. These diagrams help visualize softwa

DISCOVERY
5 Minutes
Learn how to create your very own UML timing diagram using EdrawMax’s comprehensive guide and easy-to-use diagram creation tool, complete with detailed notes on what they are, when to use them, and pr

DISCOVERY
5 Minutes
In Unified Modelling Language, composite structure diagrams are used to map out the internal structure of a system, including the collaboration and interactions between different elements. Read on for

DISCOVERY
5 Minutes
The growth-share matrix places businesses into one of four divisions defined in it by four quadrants. The process categorizes each business line into two dimensions and explains how the organizations

DISCOVERY
5 Minutes
Influence diagrams are a visualization method to chart the relationship between the main elements of a decision-setting.With EdrawMax, you can create the influence diagram with ease!

DISCOVERY
5 Minutes
An experience map is one of the techniques used by UX designers to assist them in developing confidence and interaction with the better user experience of a good or service for their consumers. It hel

DISCOVERY
5 Minutes
A creatively designed sequence chart with impressive graphics is far more eye-catching and aesthetically pleasing at the same time rather than the other sequence chart that looks more like a detailed

DISCOVERY
5 Minutes
A project calendar reflects the general working hours of the company. The project calendar specifies the time for arrangement in a team, which plays an important role in project management.

DISCOVERY
5 Minutes
QFD is a methodology that incorporates the voice of the consumer into the organisation’s structure. And ensures that the consumer’s needs are met by converting them into specified pans for the organis

DISCOVERY
5 Minutes
Sequence diagrams are a great way for software developers to model interactions between different parts of a system. Follow Edraw Max’s guide, complete with symbols and notation, a step-by-step guide

DISCOVERY
5 Minutes
Matrix diagram is a project management tool which can be used to compare and identify relationships between various sets of data. They are pictorial data sets which simplify complex relationships betw

DISCOVERY
5 Minutes
Logical and physical data flow diagrams are the two classifications of data flow diagrams. Physical data flow diagrams illustrate how a system will be implemented. It is depicted in the manner to ensu

DISCOVERY
5 Minutes
A dendrogram is used to represent and categorize hierarchical relationships among objects.If you want to explore dendrograms, head to EdrawMax with advanced and accessible features to create one for f

DISCOVERY
5 Minutes
Business require a strategic plan to run their operations smoothly, but many fail to do so. There are five simple steps in the strategic planning process that will help draft a successful plan.

DISCOVERY
5 Minutes
Strategic planning is analyzing and examining a company's goals and objectives to meet the long-term vision of the business. It creates a long-range plan and provides direction to the company to grow

DISCOVERY
5 Minutes
Business process management is a remarkable medium for companies looking out to streamline complex processes. Adapting a business process management model will yield better results for organizations a

DISCOVERY
5 Minutes
The sections covered here explain everything about a supply and demand graph, and the role it plays in the constant and consistent growth of your business in the long run.

DISCOVERY
5 Minutes
Do you want to learn and create your plan-do-check-act cycle? Then, this article is worth your time, and you are just one click away.

HOW-TO & TIPS
5 Minutes
Do you want to make a timeline for your agendas to deliver your projects on time? Then this article contains all the information you need.

DISCOVERY
5 Minutes
Do you want to learn all about the control chart? This article is worth a read as it contains all the information.

HOW-TO & TIPS
5 Minutes
Are you looking for a way to design a wedding seating chart for your big day? No worries! We have got you covered with this article.

HOW-TO & TIPS
5 Minutes
Are you confused about how to make a seating plan for your event? We have explained everything in detail that will help you make an exceptional plan.

DISCOVERY
5 Minutes
Do you want to learn the basics of making an electrical plan? This article is worth reading because it includes everything you need to know.

DISCOVERY
5 Minutes
Are you new to PFD or thinking about how to make your PFD? Then you are one click away to learn and create your PFD by using EdrawMax.
HOW-TO & TIPS
5 Minutes
If you are using Microsoft Visio, Swimlane diagrams can be created easily in it. In addition, here you will find an easy way -EdrawMax Online -to create swim lane diagrams with less efforts.

DISCOVERY
5 Minutes
The rack diagram is a two-dimensional elevation drawing representing a rack system, it is used as a server. Edraw Max is perfect for making rack diagrams. With Edraw Max, you can make a rack diagram u

DISCOVERY
5 Minutes
Edraw Max is perfect for making cluster diagrams. Use Edraw Max to make your own diagrams that capture ideas in brainstorming sessions or capture relationships in a computer network.

DISCOVERY
5 Minutes
Photosynthesis is the process by which plants make their own food. Use Edraw Max to make your photosynthesis flow chart that visualize professional concept by simply dragging and dropping symbols and

DISCOVERY
5 Minutes
With an impressive growth pattern and significant market share, IKEA has cemented its place in the home furnishing business. In this IKEA SWOT Analysis, the strengths and opportunities are listed for

DISCOVERY
5 Minutes
With a worldwide reach and billions of users over the world, Facebook has always been a market leader. From this Facebook SWOT Analysis, it is reasonable that Facebook deserves to be the top platform

DISCOVERY
5 Minutes
Through SWOT analysis of Apple, it succeeds in placing itself at the "Intersection of Liberal Arts and technology". The company's design and manufacture products are a pleasure to use. However, it see

HOW-TO & TIPS
5 Minutes
Histogram is best for data analysis and evaluation, but how to make histogram in google sheets could be your first problem. Here recommend a tool called EdrawMax which is far easier to make histogram

DISCOVERY
5 Minutes
Activity diagrams are an important part of UML used to illustrate the dynamic nature of a system. But activity diagrams are more than just regular flowcharts. Follow this guide, complete with activity

DISCOVERY
5 Minutes
Edraw Max is perfect for making professional logical network diagrams, including Cisco, AWS, GCP, and Azure. Just drag and drop symbols and shapes you need onto the canvas to make your own diagrams.

DISCOVERY
5 Minutes
Network diagrams are essential to understand the connectivity among the devices which helps to detect the problems arise with the network. Head over to the article as we explain the physical network d

DISCOVERY
5 Minutes
The organizational structure will directly impact the formation and maintenance of company culture. For this reason, we have prepared an article to help you understand everything about types of organi

HOW-TO & TIPS
5 Minutes
See how to make an action plan for improving your productivity. Plus multiple action plan templates for you to choose or customize yours with ease!

HOW-TO & TIPS
5 Minutes
If you are in search of a complete guide on how to design a house, you are going in the right direction as here we have provided a complete detail!See and try Edraw Max now!
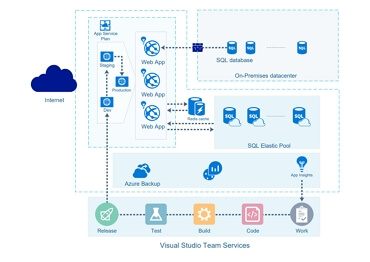
HOW-TO & TIPS
5 Minutes
Follow our tutorials to learn how to create the Azure Diagram in Visio and Edraw Max Online. Edraw is an efficient and easy drawing tool for all your diagrams.
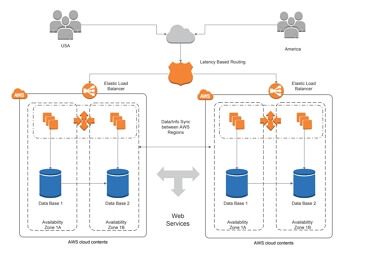
HOW-TO & TIPS
5 Minutes
To create the AWS architecture diagram in Visio, check out our tutorials. You will also learn how to make AWS architecture drawing using Edraw Max Online.

HOW-TO & TIPS
5 Minutes
Are you struggling with how to write a good SOP? A well-written SOP could make all the difference to your company operating efficiently. Follow this step-by-step, thorough guide on how to write the pe
HOW-TO & TIPS
5 Minutes
Genograms can be created on Mac using MS word and Edraw Max Online. Edraw Max is an efficient and easier way of creating a genogram on Mac in just a few simple steps.
HOW-TO & TIPS
5 Minutes
Our flowchart guides on how to make a flowchart on mac and Edraw are perfect for Mac users to know how to make flowcharts easily.

HOW-TO & TIPS
5 Minutes
Learn how to design office layout using Edraw Max in just a few minutes with the professional drawing tools and free templates.
HOW-TO & TIPS
5 Minutes
Edraw Max Online is the one-stop-shop for all types of project management drawings like PERT Charts. Follow the guide to learn how to make a PERT chart online.

HOW-TO & TIPS
5 Minutes
Learn how to make a flyer in Photoshop through the guide. If you want to make a flyer quickly without any hassle, then you can also use Edraw Max.

HOW-TO & TIPS
5 Minutes
If you want to know how to create PERT chart, follow the tutorial mentioned in this article. You can also learn how to create PERT chart using Edraw Max Online.

HOW-TO & TIPS
5 Minutes
Learn how to make a concept map in word using Edraw Max Online in just a few minutes. You can also save this concept map in word format for further use and edits.

HOW-TO & TIPS
5 Minutes
This article will tell you how to make a poster in Google docs and Edraw Max Online from scratch in just a few simple steps.

HOW-TO & TIPS
5 Minutes
Our step by step guide will tell you how to create a value stream map in excel with the help of Edraw Max Online efficiently and expertly.
HOW-TO & TIPS
5 Minutes
Learn how to make WBS in Microsoft Project using the tutorial in this article. You can also create the MS Project WBS chart on Edraw max if you want to save time and effort.

HOW-TO & TIPS
5 Minutes
To learn how to make a family tree in PowerPoint, go through this detailed guide, which will also tell you how to create a family tree in Edraw Max Online.

HOW-TO & TIPS
5 Minutes
If you want to learn how to make a family tree in Excel, then follow the simple step by step guide.

HOW-TO & TIPS
5 Minutes
Learn how to make a banner in Photoshop with the help of advanced tools available in Photoshop. Edraw Max Online offers an easy alternative to make a banner quickly and easily.

DISCOVERY
5 Minutes
Check out the latest free Visio alternative online while making your data management system easier!

HOW-TO & TIPS
5 Minutes
Creating a newsletter in Word is very simple. Learn about making a modern and professional newsletter using a template in word and Edraw Max.
HOW-TO & TIPS
5 Minutes
A fault tree analysis diagram can be made easily in PowerPoint and Edraw Max. Follow the simple steps explained in this article to learn the process.

HOW-TO & TIPS
5 Minutes
An attractive banner in Edraw Max can be created easily. Follow the steps in this article to make a banner in PowerPoint or Edraw Max.

HOW-TO & TIPS
5 Minutes
Creating a professional or simple decision tree in Word and Edraw Max is very simple. Follow the given steps to create an attractive decision tree.

HOW-TO & TIPS
5 Minutes
You can learn to create a pyramid chart in Excel and Edraw Max, following the simple steps explained in this article.

HOW-TO & TIPS
5 Minutes
Create a great flyer in Word and Edraw Max. This article will explain everything to create a flyer in Word and Edraw Max.
HOW-TO & TIPS
5 Minutes
Pestel analysis can be designed efficiently on PowerPoint and Edraw Max. This helping article explains all the steps involved in making an attractive pestel diagram.

HOW-TO & TIPS
5 Minutes
You can draw a detailed and straightforward family tree in Microsoft Word and Edraw Max. This article shows you how to draw a family tree.

HOW-TO & TIPS
5 Minutes
Learn how to create a workflow diagram online with the help of Edraw Max using free diagram templates and tools.

HOW-TO & TIPS
5 Minutes
Follow this tutorial if you want to know how to make a data flow diagram (DFD) with Edraw Max Online using templates and symbols.


