
Templates Community /
Taxonomy Chart
Taxonomy Chart
Joy
Published on 2021-03-12

 Desktop

1. Introducion
2. What is Taxonomy Chart
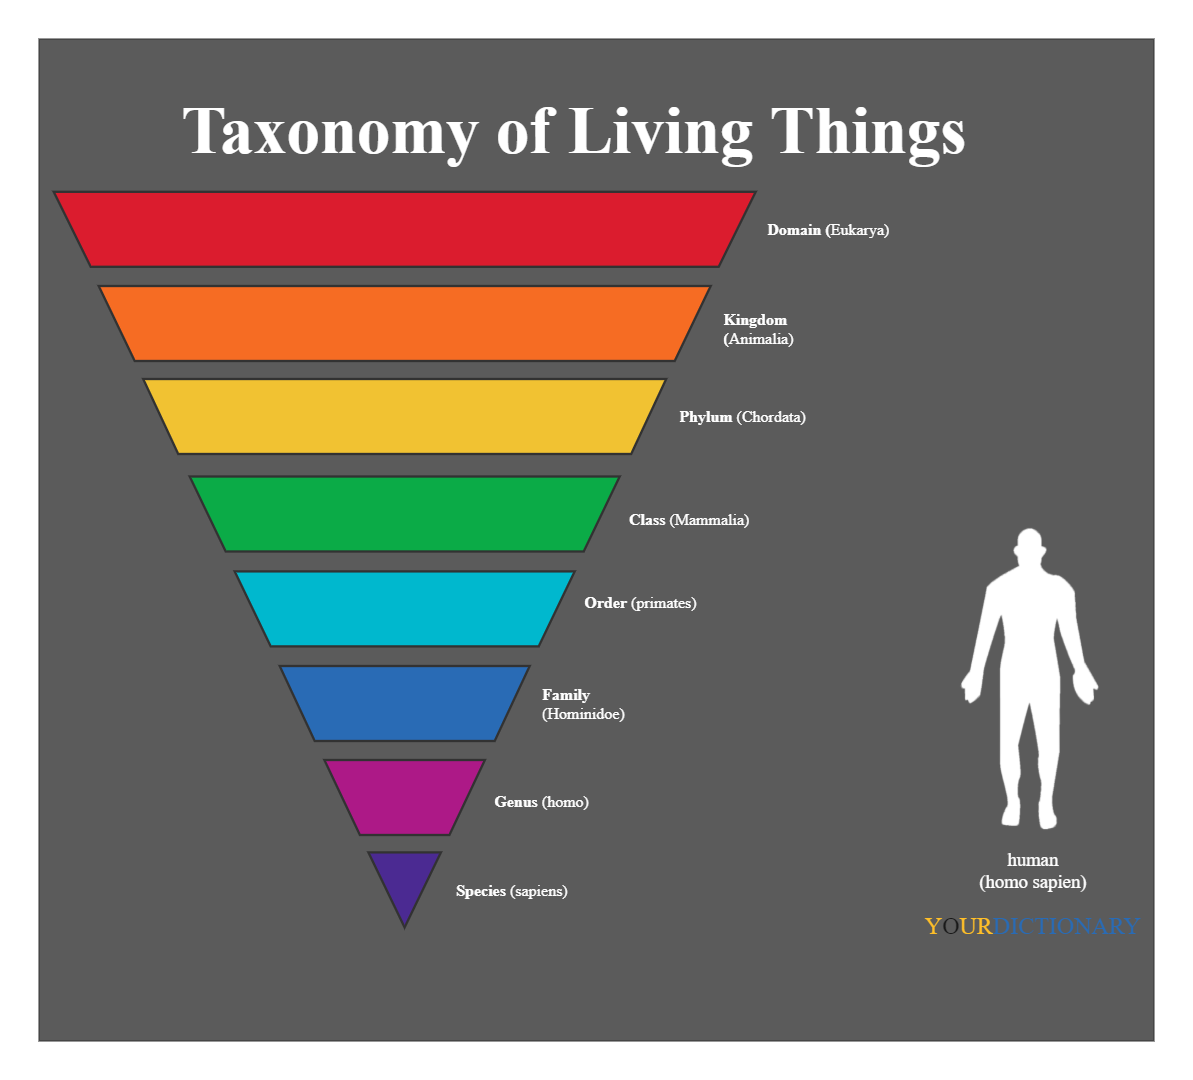
The world of living creatures consists of various organisms, from the amoeba, viruses, unicellular microbes to plants and humans who have complex structures. Considering the broad array of characteristics, R. H. Whittaker has classified living organisms into five classes.
The living thing species diversity diagram below depicts multiple living beings in a single ecosystem. They are interdependent. Though many species have adapted and evolved for survival, many plant and animal species have also become extinct. Scientists are favoring the conservation of animals in their natural habitat to protect biodiversity.
3. How to Create a Taxonomy Chart
Creating a taxonomy chart in EdrawMax Online is pretty simple. The free taxonomy chart maker has several features, like directly importing the data from the .csv file or creating one from scratch using free templates.
Step 1: Login EdrawMax Online
Log in EdrawMax Online using your registered email address. If this is your first time accessing the tool, you can create your personalized account from your personal or professional email address.
Step 2: Choose a template
EdrawMax comes with hundreds of free taxonomy chart templates. Select a pre-designed template from the product based on your preference or need by selecting the ""Business"" on the left navigation pane. It will open up several taxonomy chart types. Alternatively, press ""+"" in EdrawMax Online canvas to create a taxonomy chart from scratch.
Step 3: Customize the diagram
Customize your taxonomy chart by changing the symbols and shapes as required. With the easy drag-and-drop feature of EdrawMax Online, you can use all the relative elements from libraries.
Step 4: Export & Share
Once your taxonomy chart is completed, you can share it amongst your colleagues or clients using the easy export and share option. You can export a taxonomy chart in multiple formats, like Graphics, JPEG, PDF, or HTML. Also, you can share the designs on different social media platforms, like Facebook, Twitter, LinkedIn, or Line.
Tag
graph and chart
Graph Chart Collection
taxonomy chart
Share
Report
13
3.3k

Post
Recommended Templates
Loading
