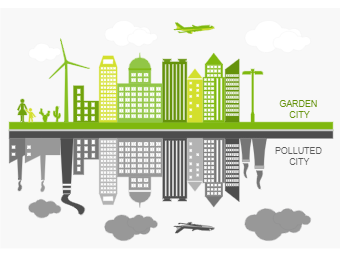
An infographic is a collection of imagery, charts, and minimal text that gives an easy-to-understand overview of a topic. As in the example below, a city pollution infographics shows two different areas of a town: one which has greenery everywhere and the other area that has factories that have caused the pollution. A city pollution infographic has three parts in general, the visual, the content, and the knowledge. The visual consists of graphics and colors. These graphics are included in all infographics and represent the underlying visual representation of the data. Following this, one can use any infographic template from EdrawMax or EdrawMax Online, which they can customize as per requirements.


 Desktop