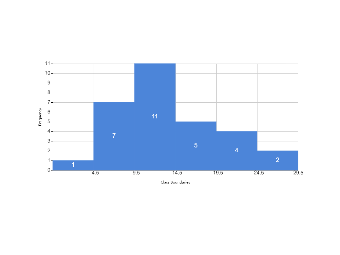
Here is a column diagram about the class boundaries. A column chart is a graphical representation or visualization of measured data in the form of vertical rectangular bars or columns plotted along two axes with the values representing the measure of that particular category of data. Learn more details from this chart, or try to make yours with ease.