
Templates Community /
Data Center Network
Data Center Network
Kiraaaa
Published on 2021-05-20

 Desktop

1. What is Data Center Network
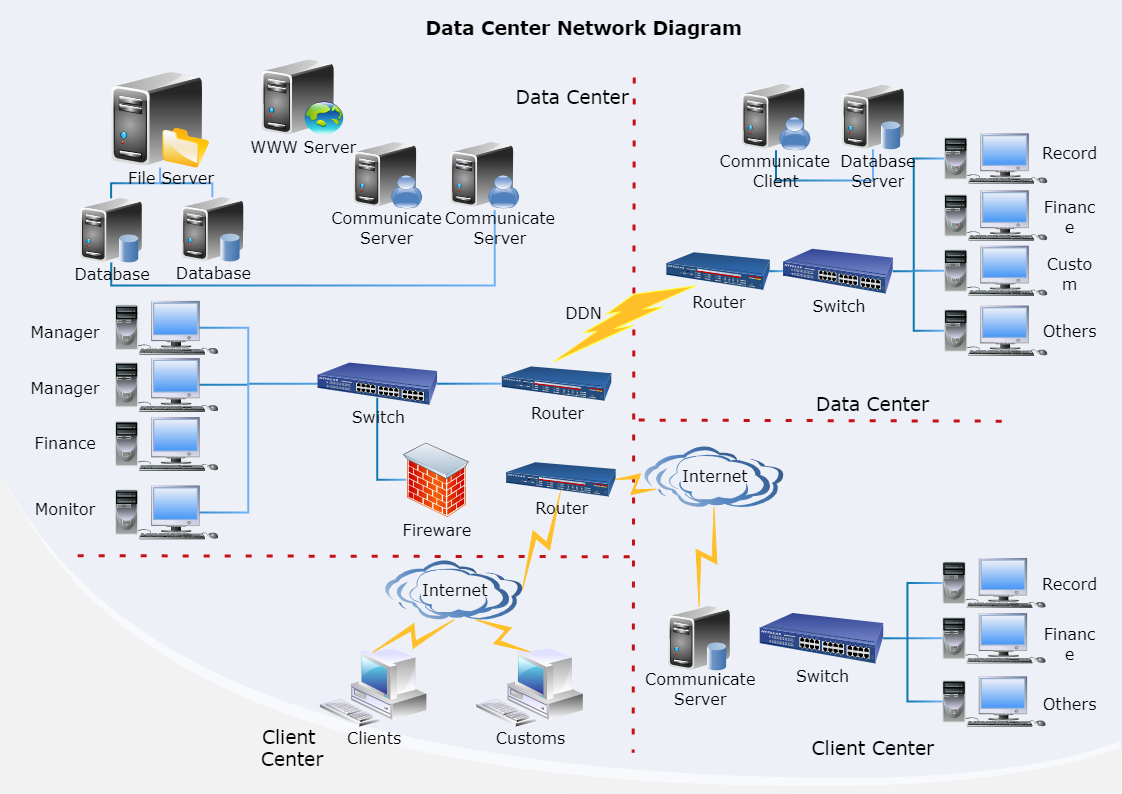
A data center network template enables a digital connection between data center infrastructure nodes and equipment to ensure that they can communicate and transfer data between each other and on an external network or internet. A data center network diagram consists of a file server, communicate server, switches, routers, firewalls, communicate client, and database server. Create a data center network diagram using EdrawMax or EdrawMax Online.
2. What is Network Diagram
Simply described, a network diagram is a schematic or map of your current network that depicts the nodes and their relationships. Network diagrams are helpful for laying out your elements and device interactions, as well as illustrating various network topology types.
3. The Usage of Network Diagram
Network diagrams can be used for a variety of tasks, including:
1) Putting together a home or office network
2) Identifying and correcting any defects or problems
3) An established network can be upgraded or updated.
4) Onboarding, communication, and planning documentation, among other things
5) Components, devices, and jobs can all be tracked.
6) Demonstrate the process and steps involved in implementing a project.
3. How to Create a Network Diagram
Step 1: Make a list of the equipment. Don't be concerned with connections at first. Instead, make a list of all the workstations, servers, routers, firewalls, and other network components. If you're using network diagramming software, simply drag forms into the canvas to do this.
Step 2: Sort the shapes into groups. Move related shapes closer to one another to start constructing your diagram. Depending on the type of diagram you're making, shapes can be related logically or physically.
Step 3: Connect the dots. A line connecting two forms indicates that they are linked in some way, most commonly by information transfer.
Step 4: Label. Include any additional information about each shape that you think your audience may find helpful. You can either put that information next to each component or number them and then add more information in a legend.
Step 5: The formatting is complete. Adjust the size, color, and other properties of your diagram elements until you're happy.
Share
Report
260
14.7k

Post
Recommended Templates
Loading
