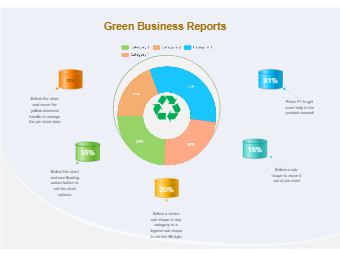
A donut chart is essentially a pie chart with an area of the center cut out. As the below image suggests, donut charts are meant to express a “part-to-whole” relationship, where all pieces together represent 100 percent. Donut charts work best to display data with a small number of categories. Using a donut chart to create a sustainable business or a green business is an enterprise that has a minimal negative impact or potentially a positive effect on the global or local environment, community, society, or economy -- a business that strives to meet the triple bottom line. As the donut chart diagram suggests, the goal of green business is to eliminate any negative impact on the environment on both a local and global scale. Use EdrawMax to create donut charts as it has hundreds of predefined templates.