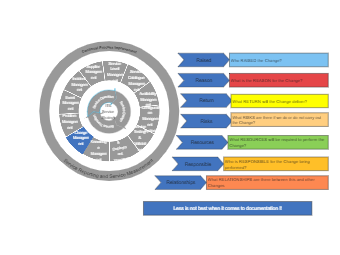
Here is a circular diagram of service reporting and service measurement. Circular diagrams can be split into segments, each one representing a data value or a set of information. If representing a data value, the segments can be sized according to how large or small the data value is.