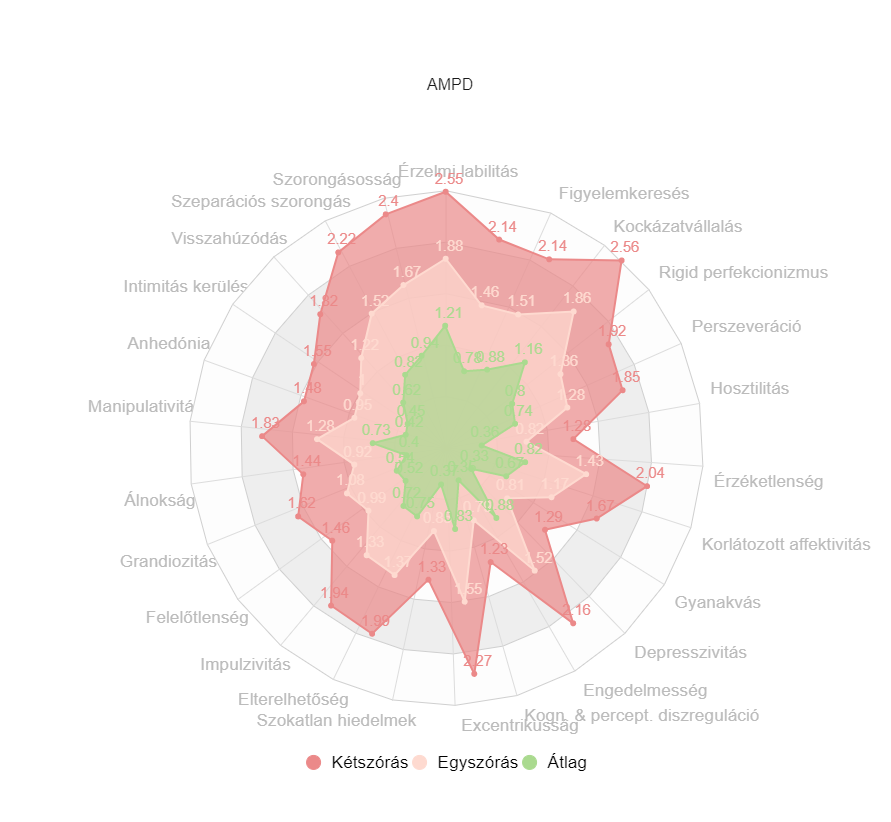
Here is a data graph about the double scattering, one spread, and the average data. The scatter chat works well when we are comparing a large number of data points and trying to show the relationship between two variables. When we are trying to identify the potential root cause of the problem, the scatter plot is used. Learn more details from this diagram, or try to make yours with ease now.