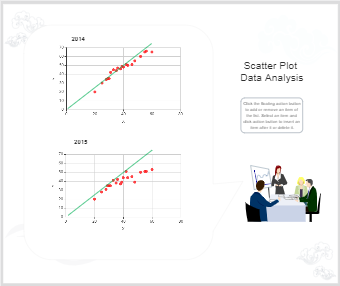
A scatter plot or scatter graph is a type of plot or mathematical diagram using Cartesian coordinates to display values for typically two variables for a set of data. The data are displayed as a collection of points, each having the value of one variable determining the position on the horizontal axis and the value of the other variable determining the position on the vertical axis. A scatter plot can suggest various kinds of correlations between variables with a certain confidence interval. These are typically used to analyse/ decide a trend based on measured parameters. This template has two sets of scatter diagrams for two consecutive calendar years with data trends in the form of points and is drawn using EdrawMax online. You can easily add or delete the values/ scatter points, this intern changes the scatter chart. And also EdrawMax lets you load data from an existing file, allows you to add labels, set min and max values along with different appearance options.


 Desktop