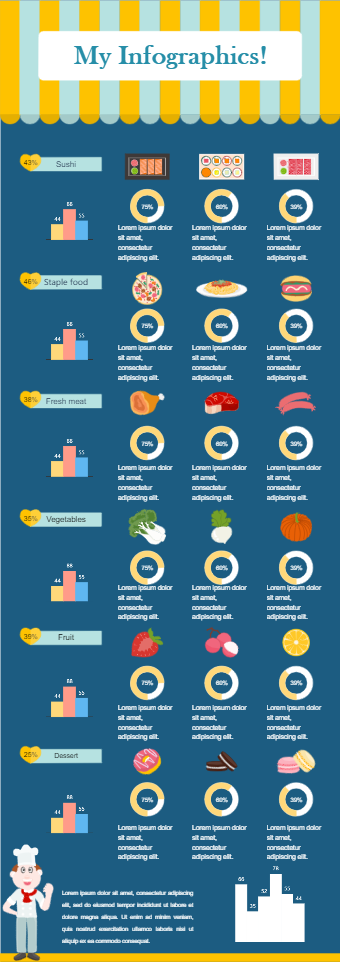
This is a diet chart infographic that visually shows the features of different types of food. It can be modified according to the age, gender and requirements of a person. The list of the food may be customized. The current options are Suchi, Staple Food, Fresh Meat, Vegetable, Fruit and Dessert. Each option is further explained through three examples and a pie chart showing percentage. It can be the percentage of a particular nutrient or mineral. For example, in the Keto diet, we might be interested in protein while for kids carbohydrates, Omega 3 Acids, Iron and calcium are important.
The percentage tag with each option may show different statistics as well. For example the requirement or ideal contribution of this option in a meal. It may also show the quantity of different nutrients in this option through a pie chart given under each food item.
It is a comprehensive diet chart infographic with many statistical artifacts added already for your ease.