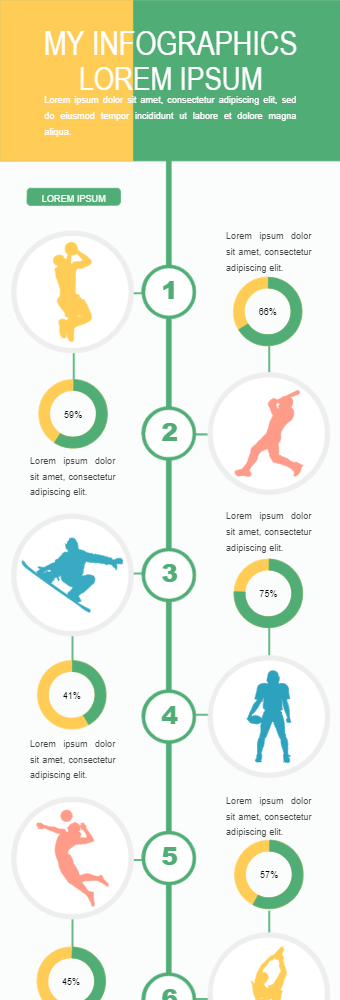
This infographic is in the form of a flow chart that can be used for both comparison and listing. The color and fonts are thematically perfect. There are different components which are connected to help build a comprehensive infographic. The graphics used are of high quality. Progressive circle chart for showing the popularity of each game. That can be used to show people play a particular game. The infographics are very creative for presenting an idea in a visually appealing and concise way without getting distracted by a lot of extra details.This infographic can be used by teachers and students to present to students. A great and engaging way to compare different games' popularity.