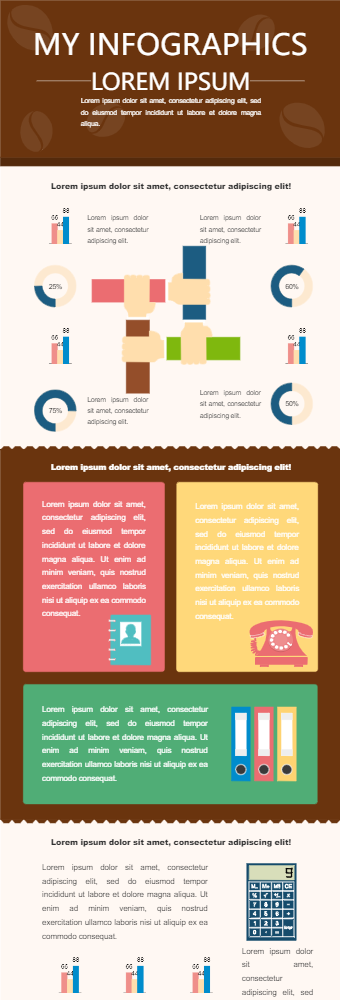
The infographic starts with a catchy headline. The color used are attention grabbing. The next is an informative infographic with a lot of components. It is consisted of different sections and each section consist of a progressive circle chart and a bar chart. Each section can present a particular smaller market. The progressive circle chart can be used to show overall growth percentage. The bar chart can be used to show sales of individual items in each market. Then next section is for adding text which can be used to shed light on business practices, culture or specific attributes of the market. In the end we have a number of cluster bar charts that can be used to present number of males, females and children in different markets. The colors and theme used is appropriate for the concepts.
This can be used by business to present to their sales growth in various markets in one compact way.