
Templates Community /
Bar Chart vs Histogram
Bar Chart vs Histogram
Lisa Anderson
Published on 2021-10-19

 Desktop

1. Introduction
It is often used to illustrate the major features of the data distribution in a convenient form. Instead of creating a design showcasing the difference between a bar chart and Histogram on a complex tool, use EdrawMax Online as it offers free bar chart templates and lets you easily draw the designs for your academics.
2. What is a Bar Chart
A bar chart or bar graph is a chart or graph that uses rectangular bars with heights or lengths proportional to the values they represent to convey categorical data. The bars can be plotted either horizontally or vertically. A column chart is another name for a vertical bar chart.
3. What is a Histogram
The most common graph for displaying frequency distributions is a histogram. Although it resembles a bar chart, there are significant variations between the two. One of the seven fundamental quality tools is this useful data collection and analysis tool.
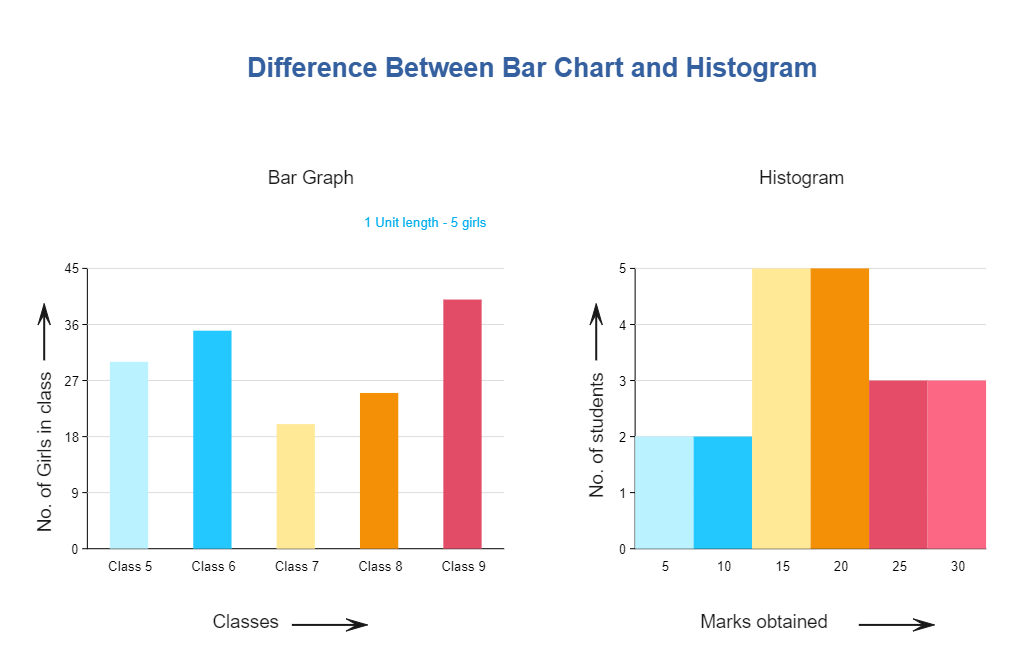
4. Bar Chart VS Histogram
The distinction between a bar graph and a histogram Histograms are a collection of interconnected bars that depict the distribution of a continuous quantitative value. To depict categorical data, bar graphs (or bar charts) employ suitably sized rectangles.
5. How to Create a Bar Chart
Creating a chart in EdrawMax is pretty simple. The free chart maker has several features, like directly importing the data from the .csv file or creating one from scratch using free templates.
Step 1: Login EdrawMax
Log in EdrawMax using your registered email address. If this is your first time accessing the tool, you can create your personalized account from your personal or professional email address.
Step 2: Choose a template
EdrawMax Online comes with hundreds of free chart templates. Select a pre-designed template from the product based on your preference or need by selecting the "Graph and Chart" on the left navigation pane. It will open up several chart types. Alternatively, press "+" in EdrawMax Online canvas to create a card from scratch.
Step 3: Customize the diagram
Customize your chart by changing the symbols and shapes as required. With the easy drag-and-drop feature of EdrawMax Online, you can use all the relative elements from libraries.
Step 4: Export & Share
Once your chart is completed, you can share it amongst your colleagues or clients using the easy export and share option. You can export a chart in multiple formats, like Graphics, JPEG, PDF, or HTML. Also, you can share the designs on different social media platforms, like Facebook, Twitter, LinkedIn, or Line.
Tag
bar chart
graph and chart
Graph Chart Collection
Share
Report
6
1.1k

Post
Recommended Templates
Loading
