
Templates Community /
Coffee Infographic
Coffee Infographic
Joy
Published on 2021-11-19

 Desktop

1. Introduction
An infographic helps summarize a topic more graphically. As you will see here, an infographic is a one-page publication that graphically presents information. To create a good infographic, you only need simple icons, symbols, maps, charts, and a tool that helps you combine all these to explain your topic's story or narrative.
As shown in the infographics below, coffee infographics or other infographics convey ideas, explore issues through a range of different graphics, and more. It should be noted here that a great infographic will convey the story without cluttering too much information. As shown in the coffee infographics below, these forms of graphical illustration present a fresh perspective on accepted knowledge of the subject.
2. What is Coffee Infographic
Making coffee is an integral morning ritual in many individuals' daily lives. Nevertheless, the influence of coffee spreads around the world. From sourcing, exporting, importing, and drinking, it is very much a growing global business. To understand more about coffee and its influence in the real world, you can create a similar-looking coffee infographic with all the right information.
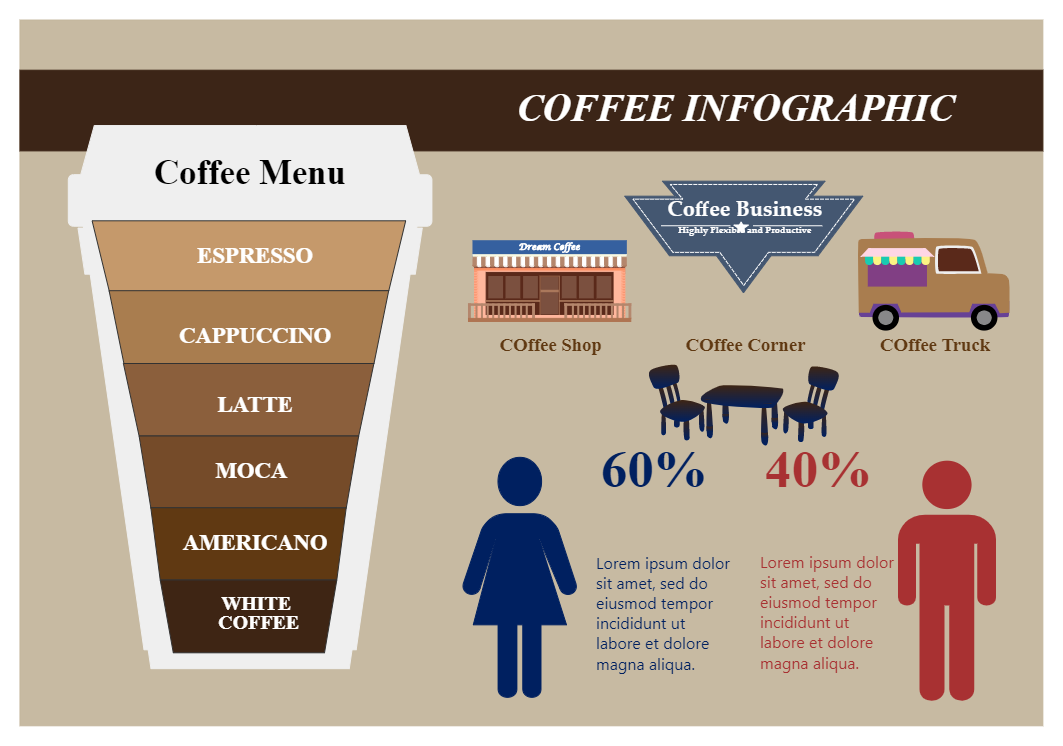
The below Coffee Infographic beautifully represents how to identify different types of coffees based on the color of the mug.
1) If it is dark brown, then it is an Espresso
2) If it is a little reddish, then it is Americano
3) If the color is a little towards the chocolate, then it is a Mocoa
4) If it is on the lighter shade of brown, then it is Latte
5) It is a Cappuccino if the color is almost of the light brown color
6) It is White Coffee if you see milk foam on the top of it.
3. How to Create an Infographic
Creating an infographic in EdrawMax Online is pretty simple. The free form maker has several features as you can instantly import the images or icons from your system or Google Drive or DropBox. The infographic maker lets you import the data right from the .csv file, or you can also import media content, like images, icons, or symbols, right from your Google Drive or DropBox.
Step 1: Login EdrawMax Online
Log in EdrawMax Online using your registered email address. If this is your first time accessing the tool, you can create your personalized account from your personal or professional email address.
Step 2: Choose a template
EdrawMax Online comes with hundreds of free infographic templates. Select a pre-designed template by entering the Keyword in the ""Search"" section or exploring different diagram sets. In this case, you will find the form under the ""Design"" section diagram types. Alternatively, you can simply click on ""+"" in EdrawMax Online canvas to create a diagram of your preference.
Step 3: Customize the diagram
Customize your infographic by adding the relevant data based on the research or your information from your business team (sales, marketing, operations, and management).
Step 4: Export & Share
Once your required infographic is completed, you can share it amongst your colleagues or clients using the easy export and share option. You can further export the diagram in multiple formats, like Graphics, JPEG, PDF, or HTML. Also, you can share the designs on different social media platforms, like Facebook, Twitter, LinkedIn, or Line.
An infographic helps summarize a topic more graphically. As you will see here, an infographic is a one-page publication that graphically presents information. To create a good infographic, you only need simple icons, symbols, maps, charts, and a tool that helps you combine all these to explain your topic's story or narrative.
As shown in the infographics below, coffee infographics or other infographics convey ideas, explore issues through a range of different graphics, and more. It should be noted here that a great infographic will convey the story without cluttering too much information. As shown in the coffee infographics below, these forms of graphical illustration present a fresh perspective on accepted knowledge of the subject.
2. What is Coffee Infographic
Making coffee is an integral morning ritual in many individuals' daily lives. Nevertheless, the influence of coffee spreads around the world. From sourcing, exporting, importing, and drinking, it is very much a growing global business. To understand more about coffee and its influence in the real world, you can create a similar-looking coffee infographic with all the right information.
The below Coffee Infographic beautifully represents how to identify different types of coffees based on the color of the mug.
1) If it is dark brown, then it is an Espresso
2) If it is a little reddish, then it is Americano
3) If the color is a little towards the chocolate, then it is a Mocoa
4) If it is on the lighter shade of brown, then it is Latte
5) It is a Cappuccino if the color is almost of the light brown color
6) It is White Coffee if you see milk foam on the top of it.
3. How to Create an Infographic
Creating an infographic in EdrawMax Online is pretty simple. The free form maker has several features as you can instantly import the images or icons from your system or Google Drive or DropBox. The infographic maker lets you import the data right from the .csv file, or you can also import media content, like images, icons, or symbols, right from your Google Drive or DropBox.
Step 1: Login EdrawMax Online
Log in EdrawMax Online using your registered email address. If this is your first time accessing the tool, you can create your personalized account from your personal or professional email address.
Step 2: Choose a template
EdrawMax Online comes with hundreds of free infographic templates. Select a pre-designed template by entering the Keyword in the ""Search"" section or exploring different diagram sets. In this case, you will find the form under the ""Design"" section diagram types. Alternatively, you can simply click on ""+"" in EdrawMax Online canvas to create a diagram of your preference.
Step 3: Customize the diagram
Customize your infographic by adding the relevant data based on the research or your information from your business team (sales, marketing, operations, and management).
Step 4: Export & Share
Once your required infographic is completed, you can share it amongst your colleagues or clients using the easy export and share option. You can further export the diagram in multiple formats, like Graphics, JPEG, PDF, or HTML. Also, you can share the designs on different social media platforms, like Facebook, Twitter, LinkedIn, or Line.
Tag
Business Infographic
infographic
Infographic Collection
Share
Report
4
400

Post
Recommended Templates
Loading
