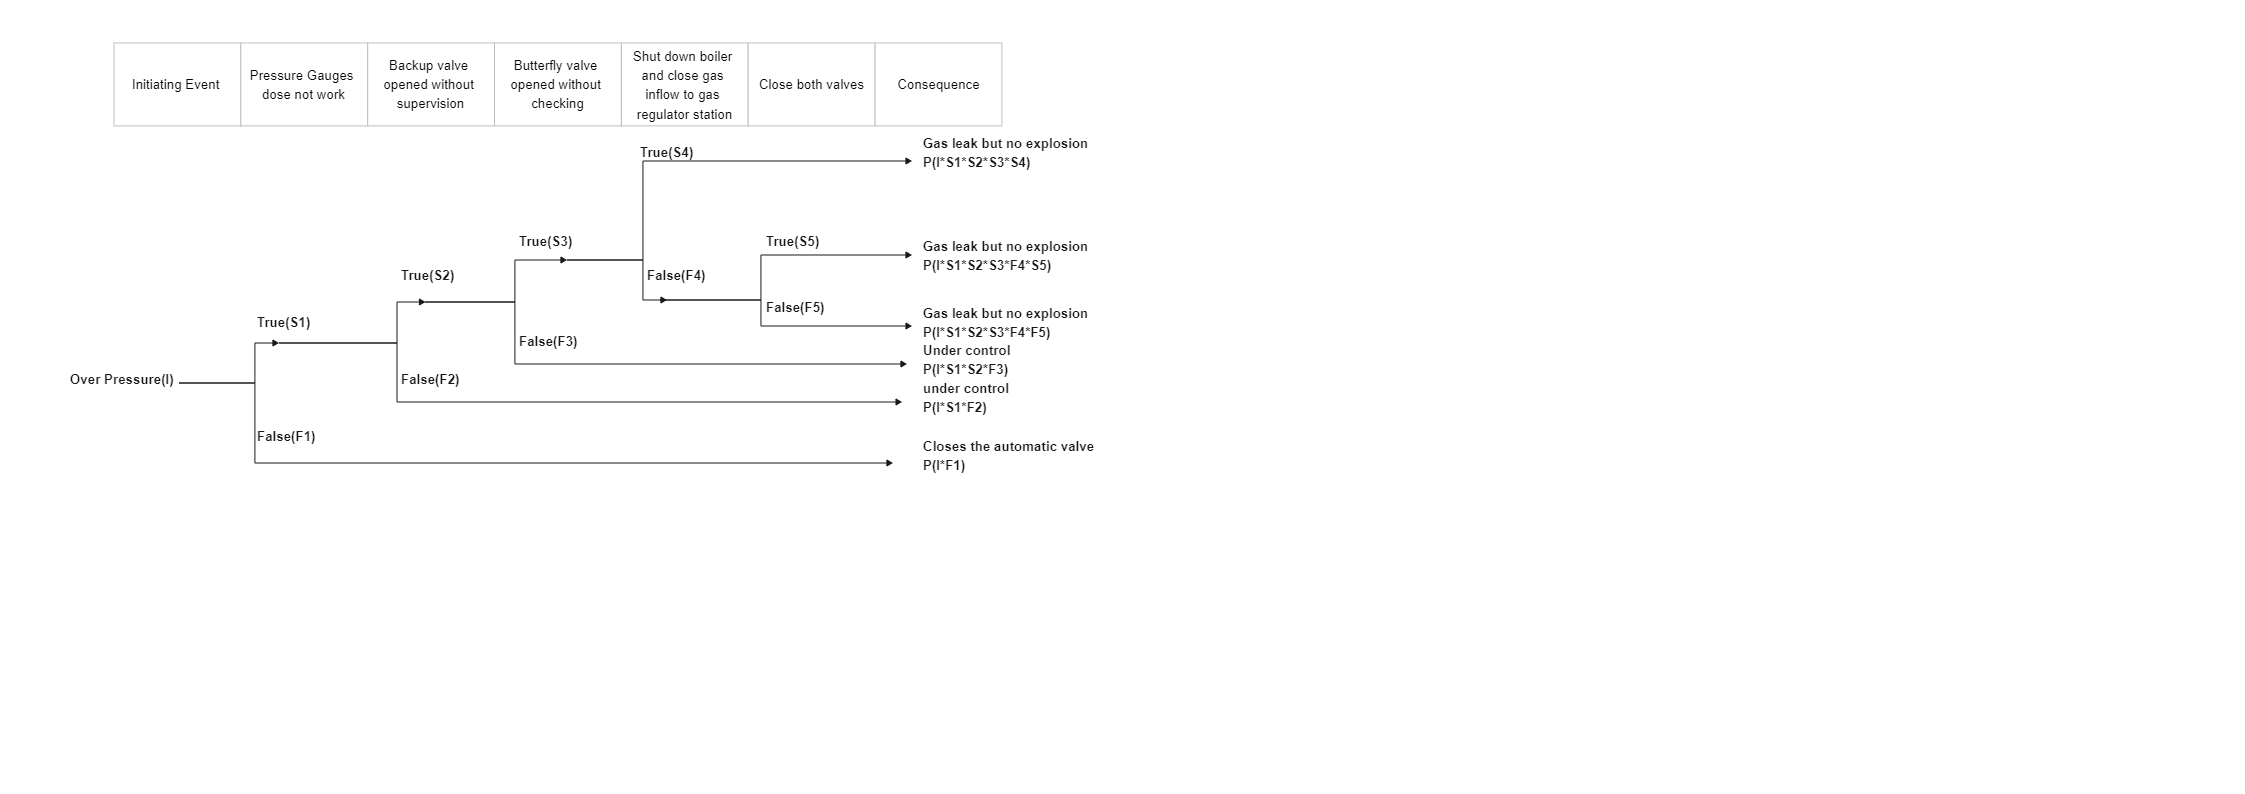
As the Gas Leak Histogram illustrates, a histogram is a chart that groups numeric data into bins, displaying the bins as segmented columns. They are used to depict the distribution of a dataset: how often values fall into ranges. In short, histogram charts are often used to illustrate the major features of the distribution of the data in a convenient form. As you will see in the Gas Leak Histogram diagram below, the process starts with 'Initiating Event,' followed by inquiring if 'Pressure Gauges Does Not Work' then checking if 'Backup Valve Opened Without Supervision,' and so on. You can use EdrawMax Online to create a similar-looking Histogram diagram for your project.