
Templates Community /
Fishbone Diagram Electrolytes
Fishbone Diagram Electrolytes
Joy
Published on 2021-11-23

 Desktop

1. Introduction
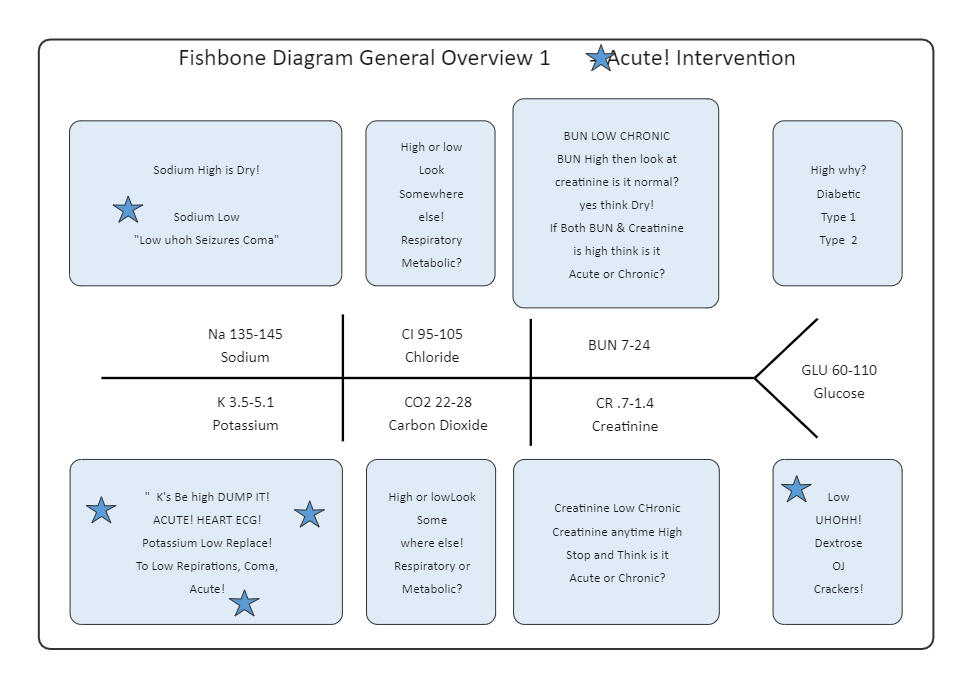
A CHEM 7 Fishbone diagram explains the distinctions between acute and chronic conditions. The Basic Metabolic Panel (BMP), often known as the Chem7 or simply the Fishbone diagram Electrolytes Panel, is a collection of seven laboratory results routinely examined in patients' serum/plasma. The first in the fishbone series was described by BUN Creatinine Sodium Potassium Glucose Chloride and CO2.
An electrolyte fishbone diagram is commonly used to display these numbers. The third column lists labs that are primarily used to assess renal function. Keep reading to know how Fishbone diagram Electrolytes can be used in labs and how EdrawMax Online lets you create one with just one click.
2. Understand Fishbone Diagram Electrolytes
The top left lab is sodium, which determines the body's water balance, moving from left to right. Potassium is shown below on the bottom left of the Fishbone diagram Electrolytes, and it's vital to keep an eye on it since even minor variations can have a big impact on heart and muscle performance.
Anions are in the second column. On top of that, there's chlorine in the below Fishbone diagram Electrolytes, which has a complicated role in setting acid/base balance. Bicarbonate is found in the second column. Bicarbonate is largely used to proxy blood carbon dioxide levels and determine acid/base status.
3. How to Create a Fishbone Diagram
Creating a fishbone diagram in EdrawMax Online is pretty simple. The free fishbone diagram maker has several features as you can instantly import the images or icons from your system or Google Drive or DropBox. The fishbone diagram maker lets you import the data right from the .csv file, or you can also import media content, like images, icons, or symbols, right from your Google Drive or DropBox.
Step 1: Login EdrawMax Online
Log in EdrawMax Online using your registered email address. If this is your first time accessing the tool, you can create your personalized account from your personal or professional email address.
Step 2: Choose a template
EdrawMax Online comes with hundreds of free fishbone diagram templates. Select a pre-designed template by entering the Keyword in the ""Search"" section or exploring different diagram sets. In this case, you will find the fishbone diagram under the ""Project Management"" section diagram types. Alternatively, you can simply click on ""+"" in EdrawMax Online canvas to create a diagram of your preference.
Step 3: Customize the diagram
Customize your fishbone diagram by adding the relevant data based on the research or your information from your business team (sales, marketing, operations, and management).
Step 4: Export & Share
Once your required fishbone diagram is completed, you can share it amongst your colleagues or clients using the easy export and share option. You can further export the diagram in multiple formats, like Graphics, JPEG, PDF, or HTML. Also, you can share the designs on different social media platforms, like Facebook, Twitter, LinkedIn, or Line.
Tag
Fishbone Diagram Collection
Share
Report
5
9.2k

Post
Recommended Templates
Loading
