
Templates Community /
BCG Matrix Example
BCG Matrix Example
Joy
Published on 2021-11-23

 Desktop

1. Introduction
BCG growth matrix was created by Boston Consulting Group’s founder Bruce Henderson in 1968. This was just a small and provocative essay named Perspectives. Right now, more than 500 fortune companies have been using it since the height of its success. It is nothing but a table divided into four sides with its unique symbol defining its profitability. By limiting their business to four quadrants, the executives will know where to focus more and spend most of their values.
The following are the few benefits of the BCG matrix:
1) It is easy to use since clear guidance is provided to each the quadrant
2) There are only two dimensions and four quadrants, so it is simple to use.
3) It helps in focusing on the important resources that generate more value
4) In the sense of large-scale manufacturing operations, the matrix is very beneficial.
2. Understand BCG Matrix
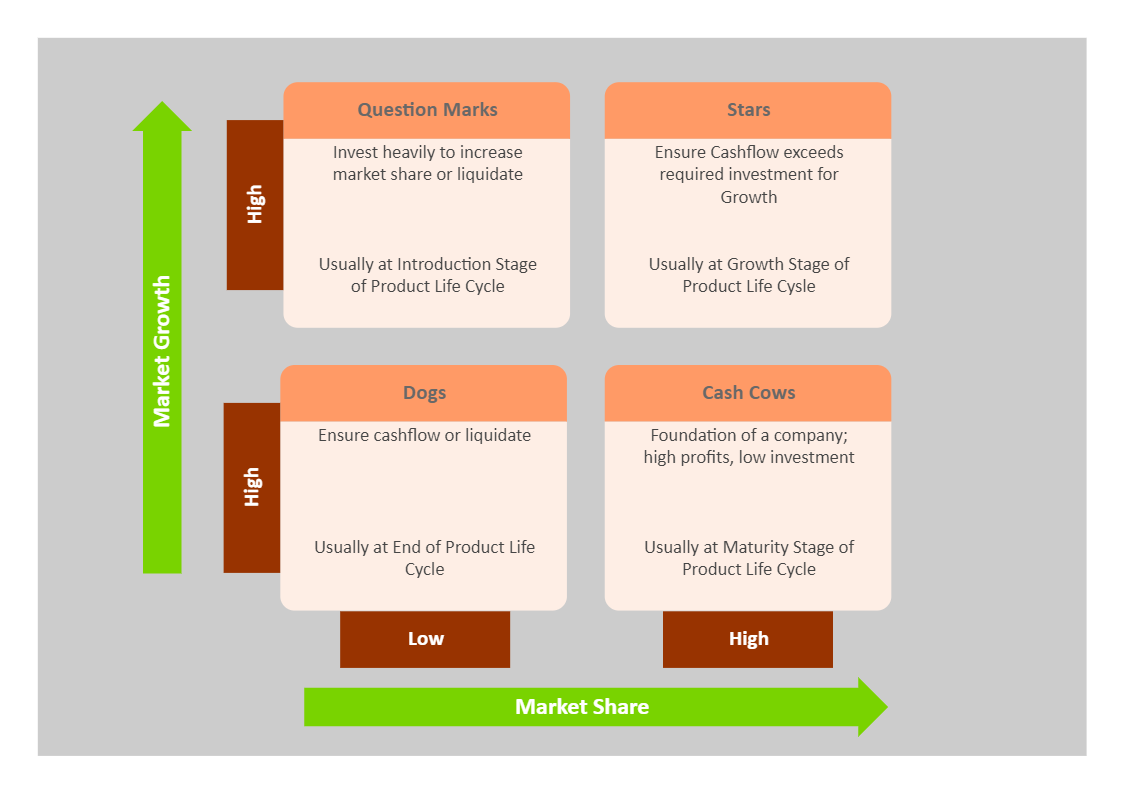
As already said, in the BCG growth matrix, there are four quadrants, and each defines its value and position. The BCG matrix includes question marks, stars, cash cows, and dogs.
The question mark is nothing but just a mystery in the BCG matrix.
Star is the brand with the highest share.
Cash cows are brands that have the highest market share value
Dogs have a small market share.
To make a BCG matrix, we should first select the product. Choosing is important, so we should choose one unit. Then define the market. Determining the market helps in understanding the portfolio position. Then calculate the market share and find out the market area. And the final step is to draw the matrix circle.
3. How to Create a Matrix Diagram
Creating a matrix diagram in EdrawMax Online is pretty simple. The free matrix diagram maker has several features as you can instantly import the images or icons from your system or Google Drive or DropBox. The matrix diagram maker lets you import the data right from the .csv file, or you can also import media content, like images, icons, or symbols, right from your Google Drive or DropBox.
Step 1: Login EdrawMax Online
Log in EdrawMax Online using your registered email address. If this is your first time accessing the tool, you can create your personalized account from your personal or professional email address.
Step 2: Choose a template
EdrawMax Online comes with hundreds of free matrix diagram templates. Select a pre-designed template by entering the Keyword in the ""Search"" section or exploring different diagram sets. In this case, you will find the matrix diagram under the ""Business"" section diagram types. Alternatively, you can simply click on ""+"" in EdrawMax Online canvas to create a diagram of your preference.
Step 3: Customize the diagram
Customize your matrix diagram by adding the relevant data based on the research or your information from your business team (sales, marketing, operations, and management).
Step 4: Export & Share
Once your required matrix diagram is completed, you can share it amongst your colleagues or clients using the easy export and share option. You can further export the diagram in multiple formats, like Graphics, JPEG, PDF, or HTML. Also, you can share the designs on different social media platforms, like Facebook, Twitter, LinkedIn, or Line.
BCG growth matrix was created by Boston Consulting Group’s founder Bruce Henderson in 1968. This was just a small and provocative essay named Perspectives. Right now, more than 500 fortune companies have been using it since the height of its success. It is nothing but a table divided into four sides with its unique symbol defining its profitability. By limiting their business to four quadrants, the executives will know where to focus more and spend most of their values.
The following are the few benefits of the BCG matrix:
1) It is easy to use since clear guidance is provided to each the quadrant
2) There are only two dimensions and four quadrants, so it is simple to use.
3) It helps in focusing on the important resources that generate more value
4) In the sense of large-scale manufacturing operations, the matrix is very beneficial.
2. Understand BCG Matrix
As already said, in the BCG growth matrix, there are four quadrants, and each defines its value and position. The BCG matrix includes question marks, stars, cash cows, and dogs.
The question mark is nothing but just a mystery in the BCG matrix.
Star is the brand with the highest share.
Cash cows are brands that have the highest market share value
Dogs have a small market share.
To make a BCG matrix, we should first select the product. Choosing is important, so we should choose one unit. Then define the market. Determining the market helps in understanding the portfolio position. Then calculate the market share and find out the market area. And the final step is to draw the matrix circle.
3. How to Create a Matrix Diagram
Creating a matrix diagram in EdrawMax Online is pretty simple. The free matrix diagram maker has several features as you can instantly import the images or icons from your system or Google Drive or DropBox. The matrix diagram maker lets you import the data right from the .csv file, or you can also import media content, like images, icons, or symbols, right from your Google Drive or DropBox.
Step 1: Login EdrawMax Online
Log in EdrawMax Online using your registered email address. If this is your first time accessing the tool, you can create your personalized account from your personal or professional email address.
Step 2: Choose a template
EdrawMax Online comes with hundreds of free matrix diagram templates. Select a pre-designed template by entering the Keyword in the ""Search"" section or exploring different diagram sets. In this case, you will find the matrix diagram under the ""Business"" section diagram types. Alternatively, you can simply click on ""+"" in EdrawMax Online canvas to create a diagram of your preference.
Step 3: Customize the diagram
Customize your matrix diagram by adding the relevant data based on the research or your information from your business team (sales, marketing, operations, and management).
Step 4: Export & Share
Once your required matrix diagram is completed, you can share it amongst your colleagues or clients using the easy export and share option. You can further export the diagram in multiple formats, like Graphics, JPEG, PDF, or HTML. Also, you can share the designs on different social media platforms, like Facebook, Twitter, LinkedIn, or Line.
Tag
grid
Matrix Diagram Collection
Share
Report
1
298

Post
Recommended Templates
Loading
