
Templates Community /
Disney BCG Matrix
Disney BCG Matrix
Joy
Published on 2021-11-23

 Desktop

1. Introduction
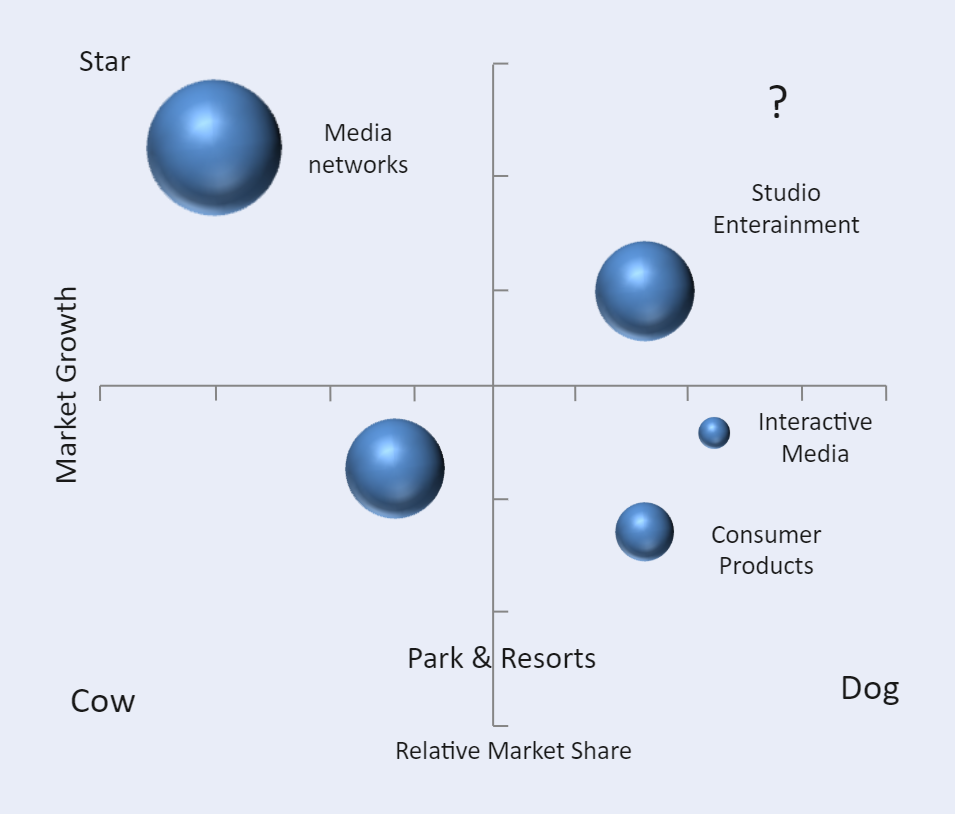
Bruce Henderson, the founder of BCG, devised the growth-share matrix in 1968. The Business Criticality Matrix is a tool that can aid with long-term strategic planning. It aids in the company's expansion by examining product lines and determining where to spend and cut back. It was employed by almost half of all Fortune 500 businesses at its peak, and it is still used in business school lessons on corporate strategy today. It provides a company with a graphical representation to assess different firms in its portfolio. In this article, the Disney BCG Matrix will be discussed. There are four quadrants in the BCG Matrix. It's based on a market growth rate and relative market share study. The matrix's four quadrants are as follows:
1) Stars: These are high-growth and high-market share products. They have very strong financial performance, and their growth level will determine that products will soon be a cash cow for the company if they are successful in maintaining the future growth rate.
2) Question Mark: These are products with high growth but relatively low market share. It should be noted here that people are now using digital technology more than conventional ones and are willing to be aware of things more easily through digital media.
3) Cash Cow: As we see in the image below, the Consumer Products and Studio Entertainment of Walt Disney fall in this category. Both are considered cash cows because of the increase in their sales every year, but there are no such additions in the consumers' features, operations, and offerings.
4) Dogs: These are low-growth and low-market-share products. These products are not bringing any significant benefit to the company, and if they are shut down, they do not bring any loss.
2. Understand Disney BCG Matrix
BCG Matrix is the Boston Consulting group's product portfolio matrix short form. Companies and firms commonly use this diagram as a tool for growth in their business. So it is also known as the Growth/Share matrix. It is also founded on the notion that market share can be attained by investing more in the marketing budget.
3. How to Create a Matrix Diagram
Creating a matrix diagram in EdrawMax Online is pretty simple. The free matrix diagram maker has several features as you can instantly import the images or icons from your system or Google Drive or DropBox. The matrix diagram maker lets you import the data right from the .csv file, or you can also import media content, like images, icons, or symbols, right from your Google Drive or DropBox.
Step 1: Login EdrawMax Online
Log in EdrawMax Online using your registered email address. If this is your first time accessing the tool, you can create your personalized account from your personal or professional email address.
Step 2: Choose a template
EdrawMax Online comes with hundreds of free matrix diagram templates. Select a pre-designed template by entering the Keyword in the ""Search"" section or exploring different diagram sets. In this case, you will find the matrix diagram under the ""Business"" section diagram types. Alternatively, you can simply click on ""+"" in EdrawMax Online canvas to create a diagram of your preference.
Step 3: Customize the diagram
Customize your matrix diagram by adding the relevant data based on the research or your information from your business team (sales, marketing, operations, and management).
Step 4: Export & Share
Once your required matrix diagram is completed, you can share it amongst your colleagues or clients using the easy export and share option. You can further export the diagram in multiple formats, like Graphics, JPEG, PDF, or HTML. Also, you can share the designs on different social media platforms, like Facebook, Twitter, LinkedIn, or Line.
Tag
grid
Matrix Diagram Collection
Share
Report
10
4.8k

Post
Recommended Templates
Loading
