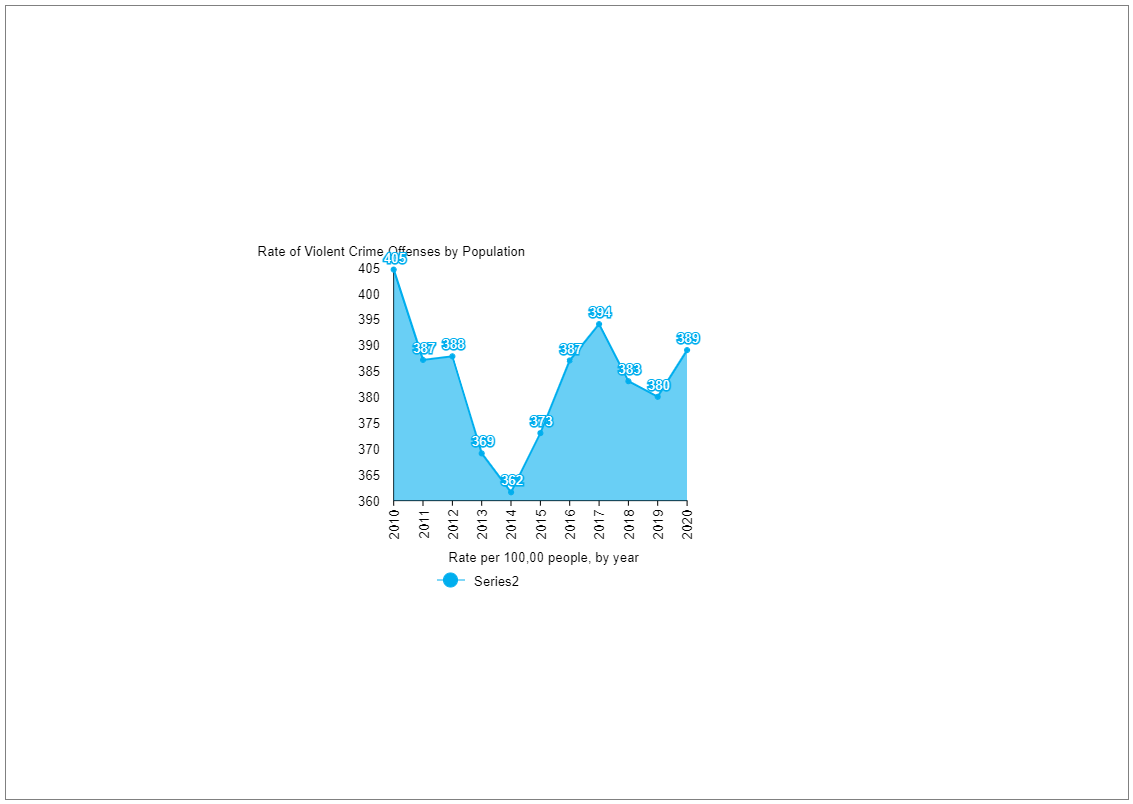
The rate of Violent Crime can be illustrated using an area graph. As the diagram suggests, area graphs are line graphs but below the line filled in with a certain color or texture. It should be noted here that area graphs can show how something changes over time. They can be used when you plot data that has peaks (ups) and valleys (downs) or that was collected in a short period. The following pages describe the different parts of an area graph. EdrawMax Online comes with free area graph templates that help create similar-looking rates of violent crime diagrams. As per the North American government, violent crime consists of five criminal offenses: murder and non-negligent manslaughter, rape, robbery, aggravated assault, and gang violence; property crime consists of burglary, larceny, motor vehicle theft, and arson.