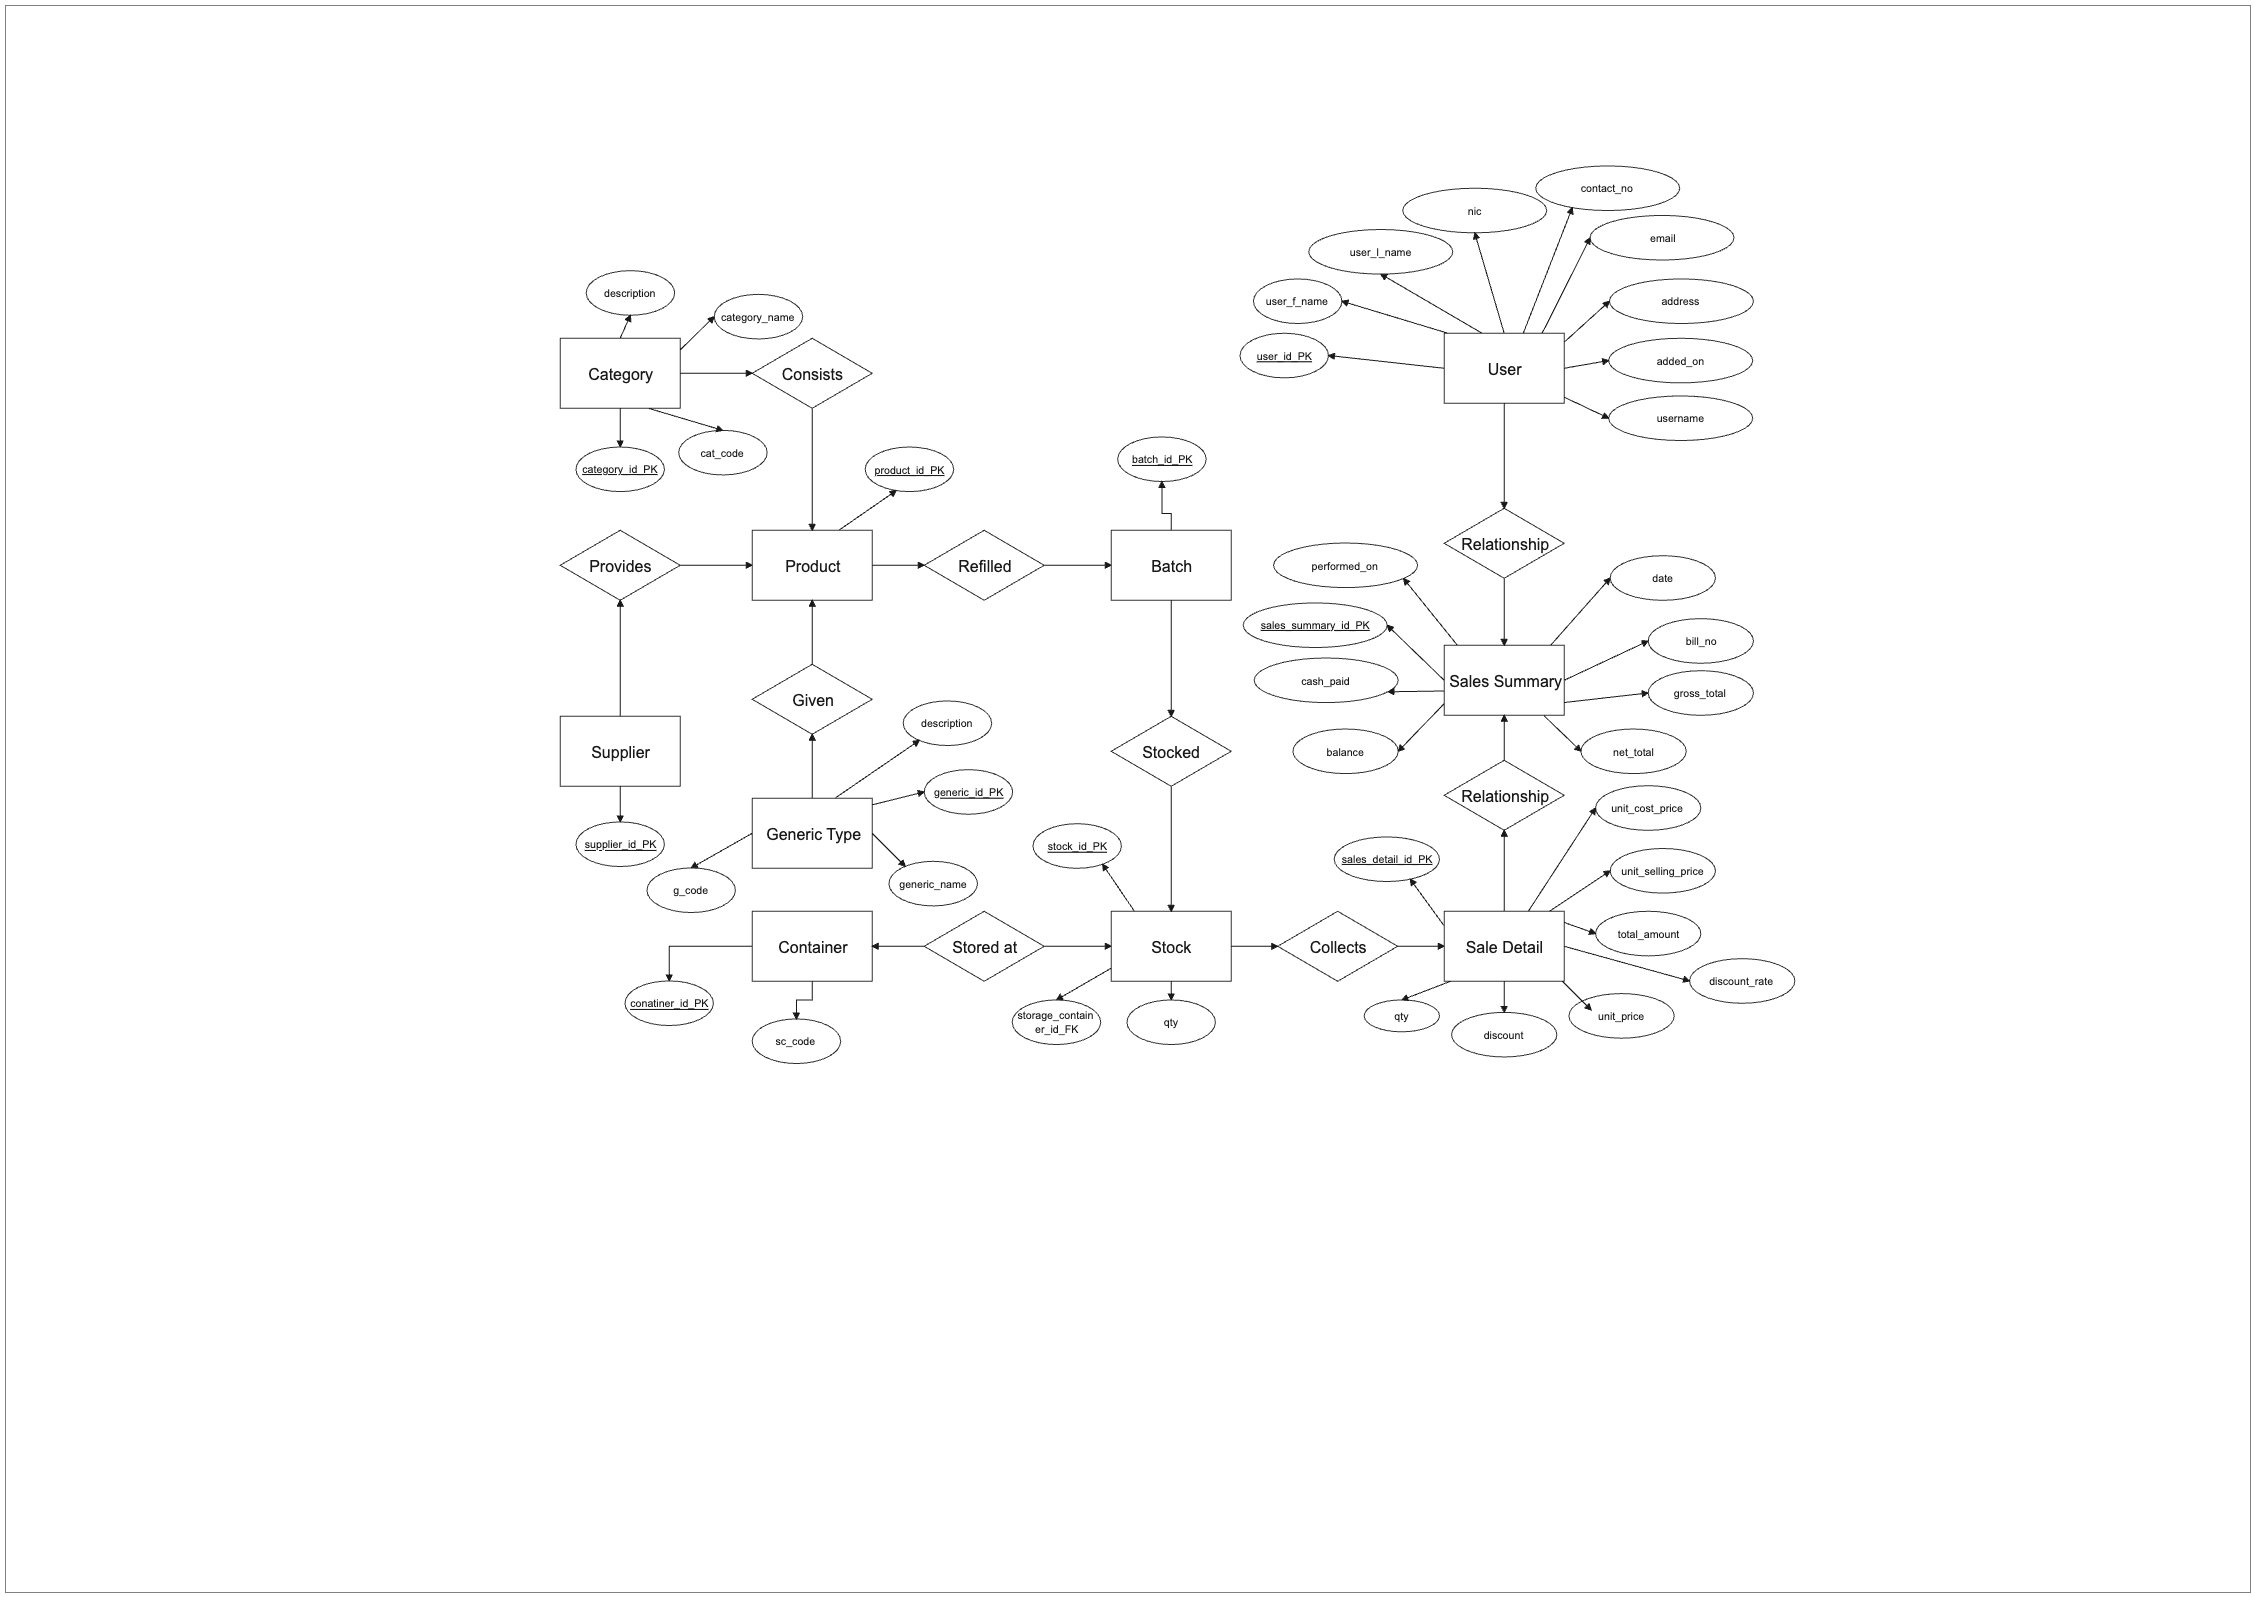
The Entity Relationship Diagram (ERD) for Product, Batch, Sales Summary, and Stock is a diagram that shows the relationships between the different entities involved in a product-based business. The diagram depicts the product as the central entity, with relationships to batches, sales summaries, and stock. The batch entity represents a specific production run of a product, while the sales summary entity represents the total sales of a product over a specific time period. The stock entity represents the current inventory levels of a product. The ERD shows the relationships between these entities, such as the one-to-many relationship between the product and batch entities, the many-to-one relationship between the sales summary and product entities, and the one-to-one relationship between the product and stock entities. This diagram is useful for understanding the relationships between different entities in a business and how they relate to each other in the context of product production, sales, and inventory management. EdrawMax is the best diagramming tool to create similar diagrams. Download EdrawMax today and start customizing similar templates.


 Desktop