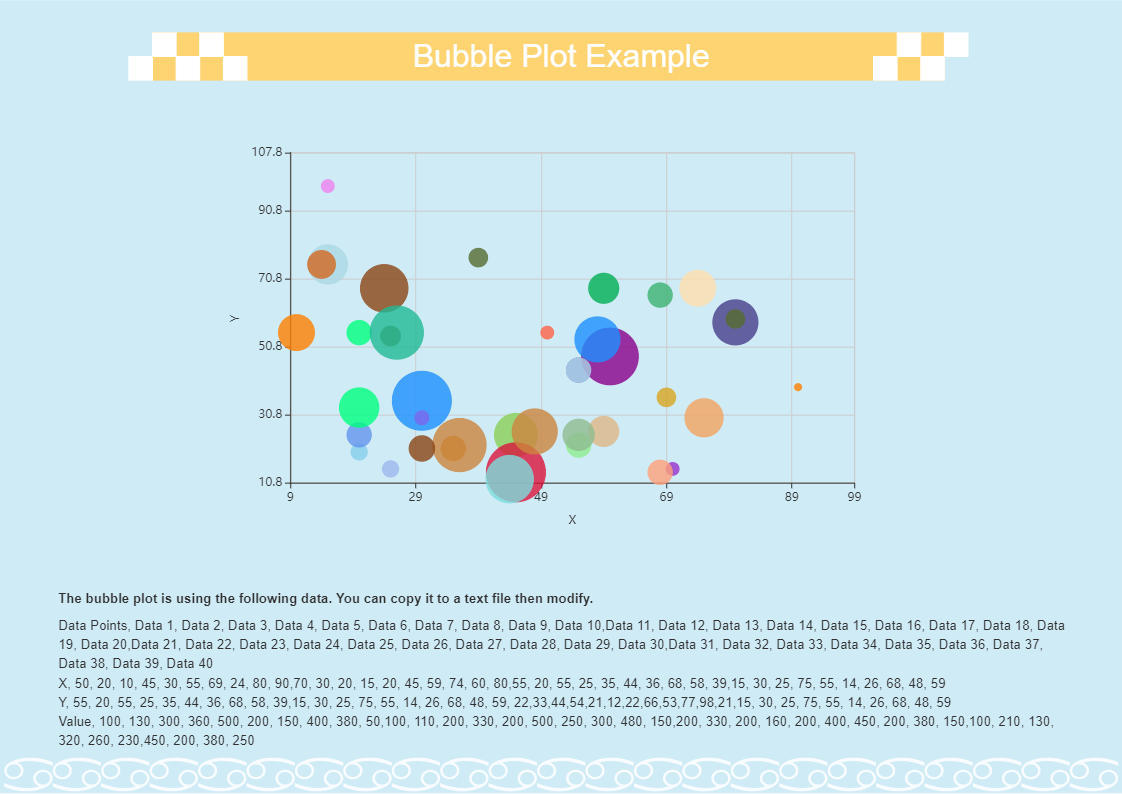
A bubble chart is a type of chart that displays three dimensions of data. It is an extension of the scatter plot used to look at relationships between three numeric variables. Bubble Charts use a Cartesian coordinate system to plot points along a grid where the X and Y axis are separate variables. Each point is assigned a label or category (either displayed alongside or on a legend). Each plotted point then represents a third variable by the area of its circle. Colours can also be used to differentiate between categories or used to represent an additional data variable. The following bubble chart art has been drawn using EdrawMax online. There are 40 data sets representing X and Y values are placed on the chart. And each bubble size varies based on the third data set value. There is also place provided to add all this data at bottom and place for heading for the chart at top. All the dummy text in this diagram is replaceable, even the background colour and you can easily add or delete points, this intern changes the bubble chart. And also, EdrawMax lets you load data from existing file and set min and max values for axis with different appearance options. Instead of creating the bubble chart from scratch, use EdrawMax online as it provides pre-defined templates, shapes, and figures which will help you create the bubble bar chart with ease.


 Desktop