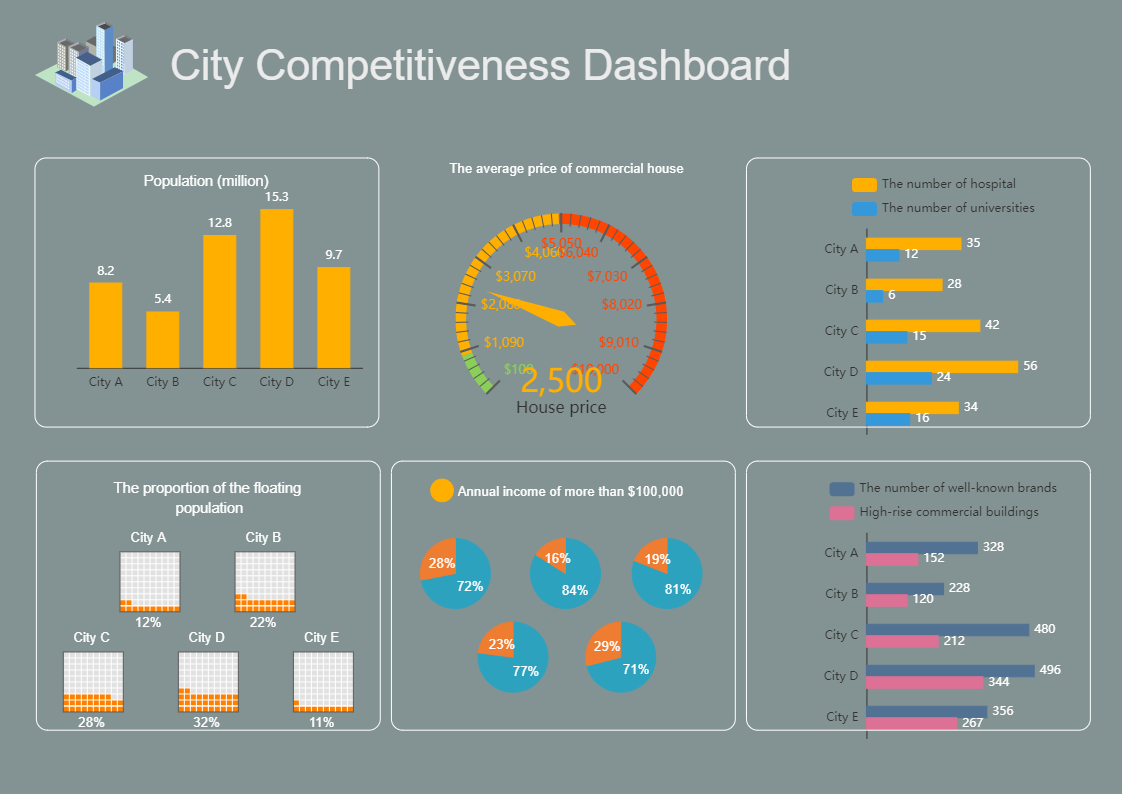
A competitive chart/ matrix is an industry analysis tool that compares the characteristics of multiple brands / data / characteristics within your market segment to identify their differences, strengths, and weaknesses. A competitive matrix can be as simple as a chart that lists each competitor along with a list of their features and benefits. The following competitive chart has been drawn using EdrawMax online. This is for “City competitive Dashboard” and is cluster of multiple charts like column chart, pie chart along with multiple visual representations and many more. Here multiple cities are compared based on population, income, building and more. There is also place provided to add the heading for the chart at top. All the dummy text in this diagram is replaceable, even the background colour and you can easily add or delete points, this intern changes the city competitive dashboard. And also, EdrawMax lets you load data from existing file and set min and max values for axis with different appearance options. Instead of creating the “City competitive dashboard” from scratch, use EdrawMax online as it provides pre-defined templates, shapes, and figures which will help you create the “City competitive dashboard” with ease.


 Desktop