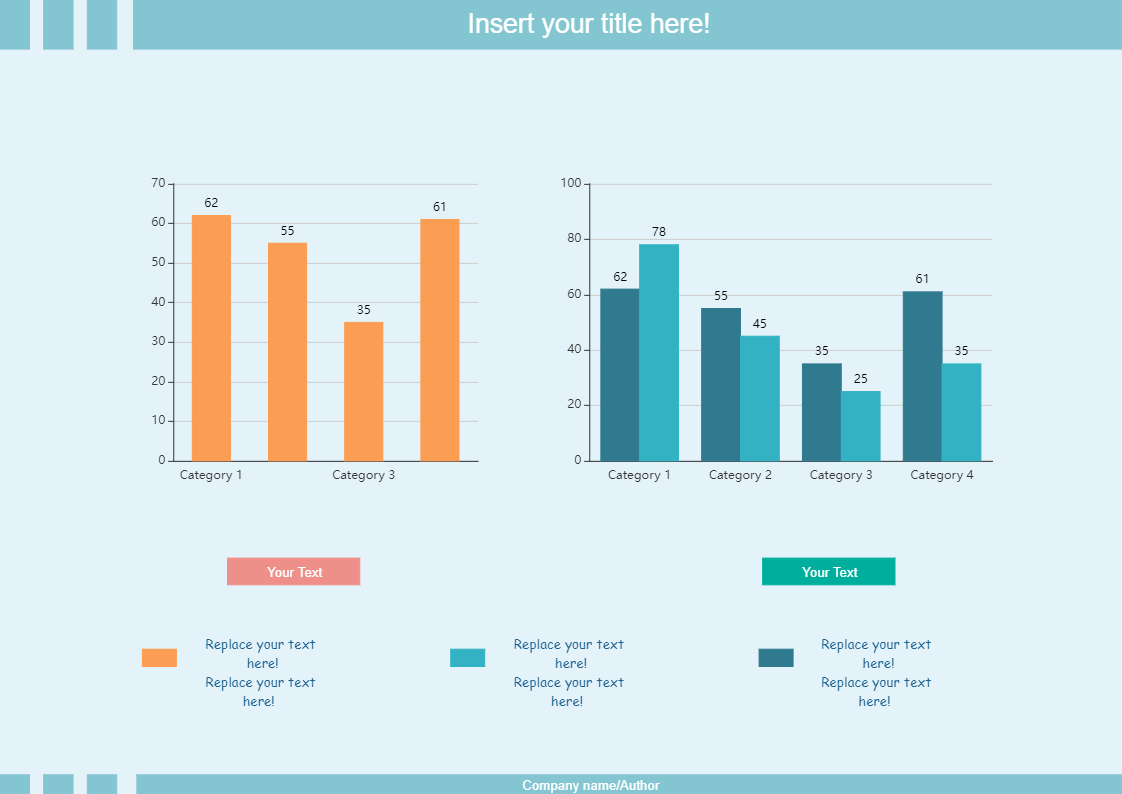
A column chart is a graphical representation in which each category is represented by a rectangle, with the height of the rectangle being proportional to the values being plotted. Column charts are also known as vertical bar charts. It is one of the most common charts used in the field of Data Visualization and one of the easiest to understand. Column charts are a great way to compare multiple sets of data in one chart. In the following template there are two charts being used, one is usual column chart and the other being clustered or grouped column chart. This template has simple column chart along with clustered or grouped column chart mapped against a 2-D coordinate system to represent data from 3 different sets / series of data. A clustered column chart is useful for comparing value between different categories, each having several sub-categories. Also, there is place to add heading for the chart along with description at the bottom of the chart. This particular chart has been drawn using EdrawMax online. All the dummy text in this diagram is replaceable, even the background colour and you can easily add or delete category, this intern changes the column chart. And also, EdrawMax lets you load data from existing file, set max values for axis and allows to choose different appearance option. Instead of creating the column chart from scratch, use EdrawMax online as it provides pre-defined templates, shapes, and figures which will help you create the column chart with ease.


 Desktop