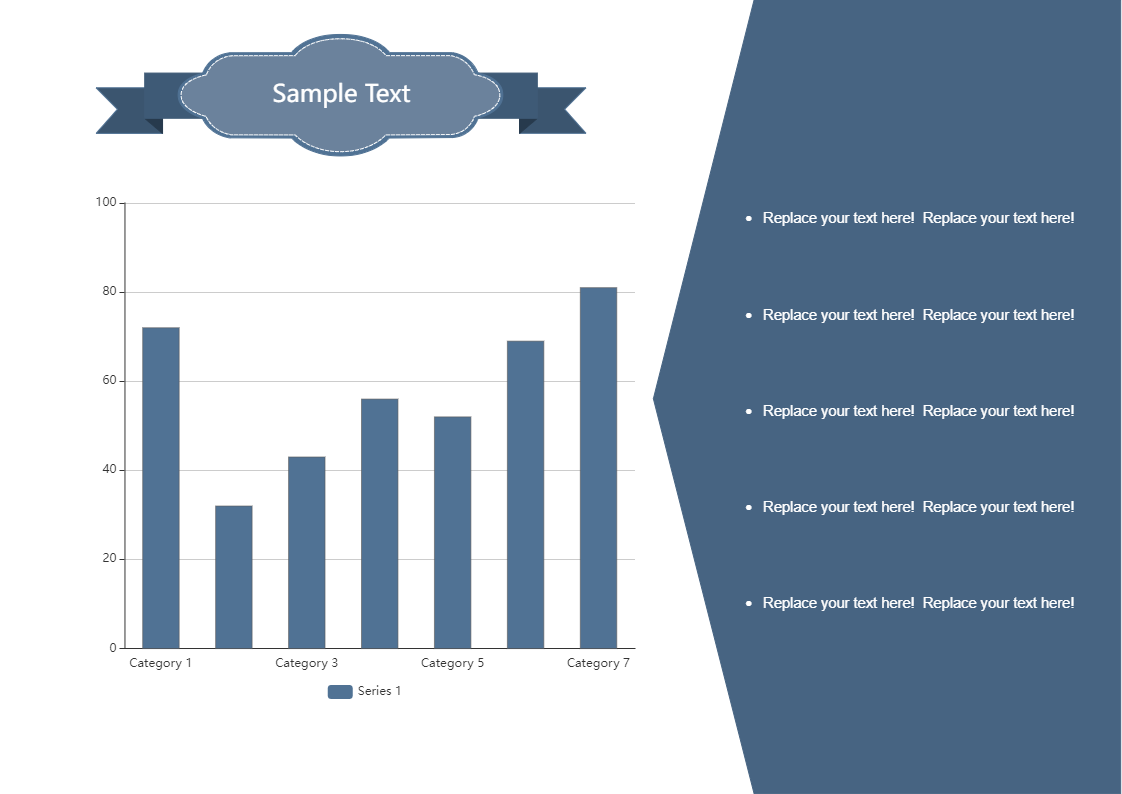
The “100% Stacked Column” chart is an extension of the Stacked Column chart in that it compares the percentage that each value contributes to a Total. “100% Stacked column” chart is different from the Stacked Column Chart only in terms of representation of the column bars. In a Stacked Column chart, the height of each bar is the total value of a category, in “100% Stacked Column” Chart, the height of each bar is the same that is 100% and the segments are shown as a percentage of the total value. This particular chart has seven categories that have been compared with one another. There is also place to add header for the chart along with place to detailed description on the right side. This has been drawn using EdrawMax online. All the dummy text in this diagram is replaceable, even the background colour and you can easily add or delete category, this intern changes the column chart. And also, EdrawMax lets you load data from existing file, set max values for axis and allows to choose different appearance option. Instead of creating the cluster column chart from scratch, use EdrawMax online as it provides pre-defined templates, shapes, and figures which will help you create the chart with ease.


 Desktop