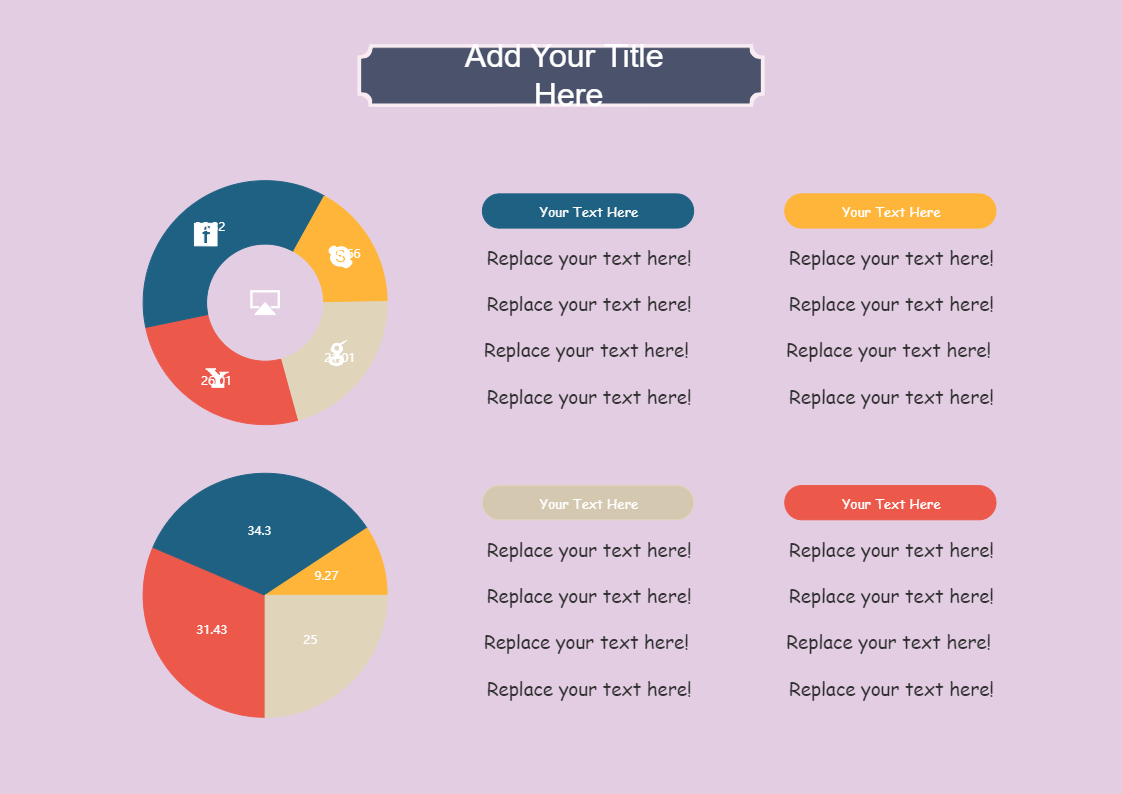
Pie charts are one of the most commonly used charts for data visualization, because they are as easy to create and easy to understand. A pie chart is a statistical graph for plotting numerical proportions. The scale of the variable is proportional to the length of the arc on the circumference of the graph. Radial lines are used to connect the arcs to the centre of the circle, thus dividing the pie into slices. The doughnut chart is a variation of the pie chart. Both the charts are quite similar in the way they look and function. The only difference is the doughnut chart has a cut out centre. The centre of the doughnut chart can be used to render additional information like the total of all data values. So, rendering data labels and data values separately is not required. The following template consists of 4 series data in the doughnut chart and percentage data for the pie chart. In this template, the usage/ popularity of different social media platforms like Facebook, Skype, Google and Yahoo is being portrayed. And there is also space in the template to list information regarding that particular platform. This template has been created using EdrawMax online. All the dummy text in the template is replaceable, even the background colour. And you can easily change the doughnut chart and pie chart by editing the value. Instead of creating the chart from scratch, use EdrawMax online as it provides pre-defined templates, shapes, and figures which will help you create the chart with ease.


 Desktop