
Templates Community /
Group Investment Case Bar Chart
Group Investment Case Bar Chart
Captain O Captain
Published on 2021-12-24

 Desktop

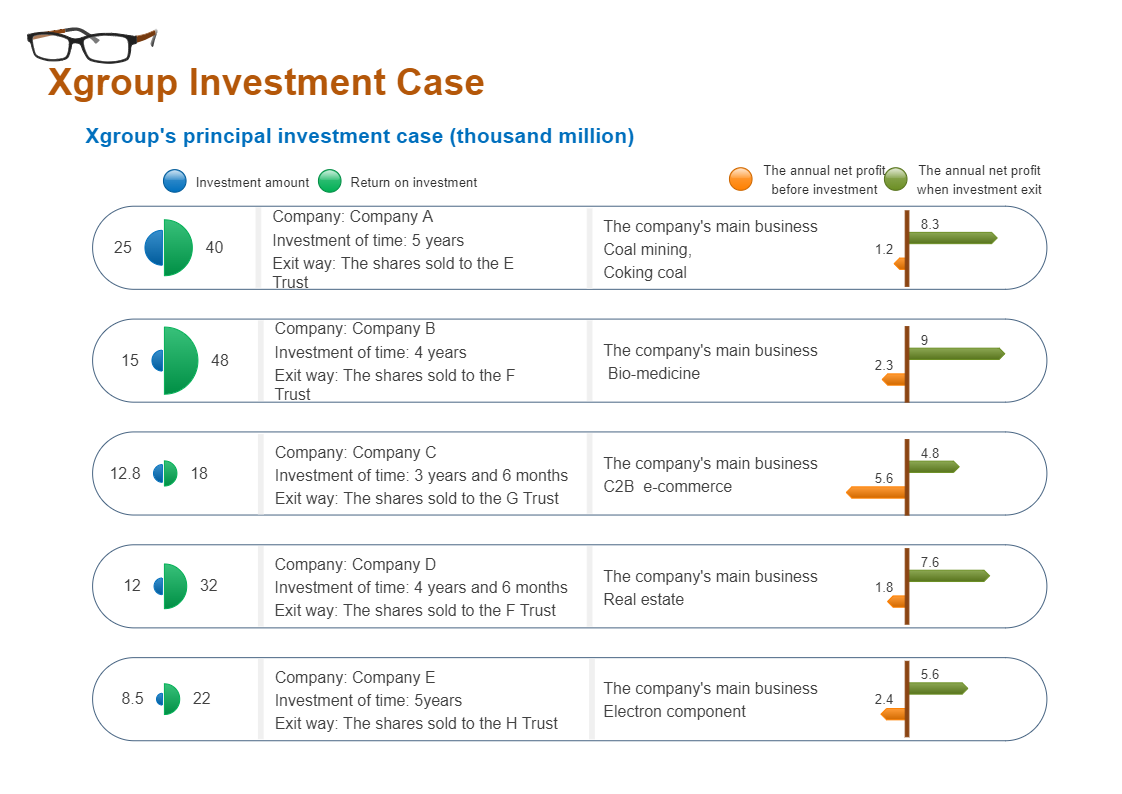
Financial graphs and charts visually track liquidity, budgets, expenses, cash flow, and many other financial metrics while helping businesses avoid a monetary crisis by leveraging financial data in real-time, with a comprehensive overview of financial information. When it comes to digesting and taking action upon vital financial metrics and insights, well-designed finance graphs and charts offer the best solution. The three standards that are applied when it comes to visual aids of this kind are, graphs and charts should display unambiguous information, meaningful data, and presently said insights in the most efficient way possible. It’s clear that by leveraging the power of robust graphs that deliver accurate, reliable, and clear-cut financial insights, busy finance departments will be able to make sense of the insights before them, resulting in success and evolution, rather than getting bogged down with droves of meaningless and convoluted data. The following template consists of the investment case for five different companies. Here the left side of the chart, there is 50% pie chart where the investment and return on investments are shown. In addition, on the right hand side the bar chart (bi-directional bar chart) show profit before and after investment. There is a place to add multiple transactions for each company. This particular template has been created using EdrawMax online. All the dummy text in the template is replaceable, even the background colour. Instead of creating the chart from scratch, use EdrawMax online as it provides pre-defined templates, shapes, and figures which will help you create the chart with ease.
Tag
bar chart
bar graph
Share
Report
5
302

Post
Recommended Templates
Loading
