
Templates Community /
Gauge Chart
Gauge Chart
Captain O Captain
Published on 2021-12-24

 Desktop

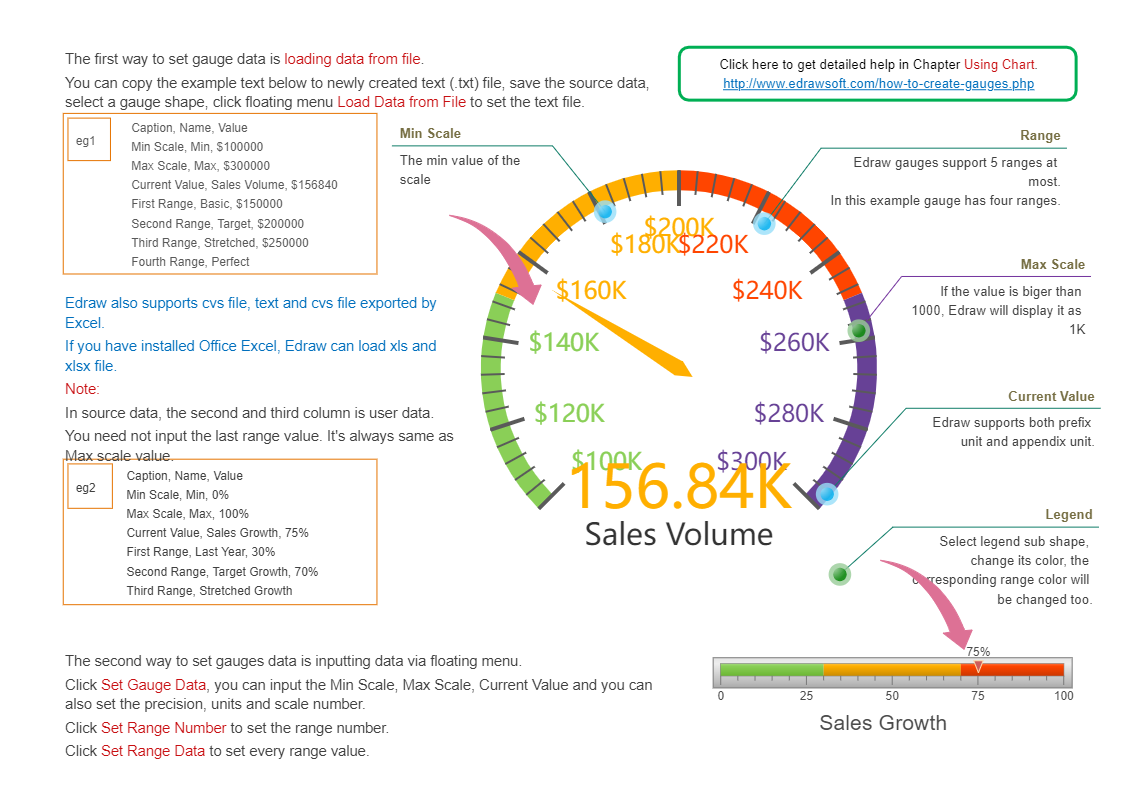
Gauge charts, also known as dial charts or speedometer charts. They use needles to show information as a reading on a dial. These chart types are often used in executive dashboard reports to show key business indicators. Gauge charts are useful for comparing values between small numbers of variables either by using multiple needles on the same gauge or by using multiple gauges. The value for a gauge chart, each needle is read against the coloured data range or chart axis. A gauge chart consists of a gauge axis (which contains the data range, colour ranges, and intervals markers), needles, and a centre pivot point. The following example shows a basic gauge chart with default attributes. It is a degree dial chart with two poles. The following template consists of two different gauges, 1st is the dial gauge or speedometer gauge with money listed as the attribute. This is value is listed on gauge into four different groups of sales volume starting from 100K to 300K. One can edit this to show the required data. In addition to this, there is a smaller gauge where one can represent sales growth criteria in percentage data. There is also ample space provided to add description and additional details for these gauges charts. This particular template has been created using EdrawMax online. All the dummy text in the template is replaceable, even the background colour. Instead of creating the chart from scratch, use EdrawMax online as it provides pre-defined templates, shapes, and figures which will help you create the chart with ease.
Tag
Gauges
graph and chart
Graph Chart Collection
Share
Report
6
1.4k

Post
Recommended Templates
Loading
