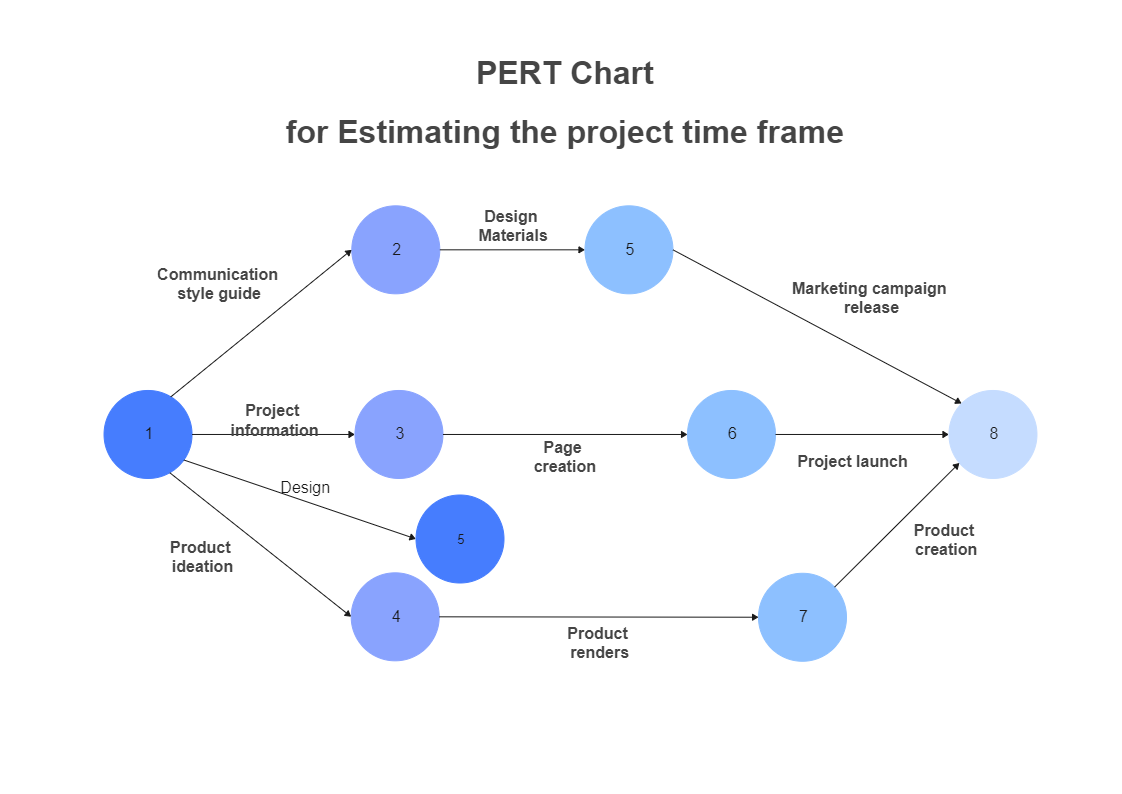
Here is a PERT chart for calculating project timeframes. A PERT chart is a project management tool that shows the chronology of a project graphically. The Program Evaluation Review Technique (PERT) deconstructs a project's separate activities for study. Because they indicate job relationships, PERT charts are preferred over Gantt charts, however they are typically more difficult to comprehend. A PERT chart assists a project manager in analyzing a project's tasks and estimating the time needed to finish each activity. The project manager may estimate the least amount of time necessary to accomplish the project using this information. This data also aids the project manager in preparing a project budget and determining the resources required to complete the project.