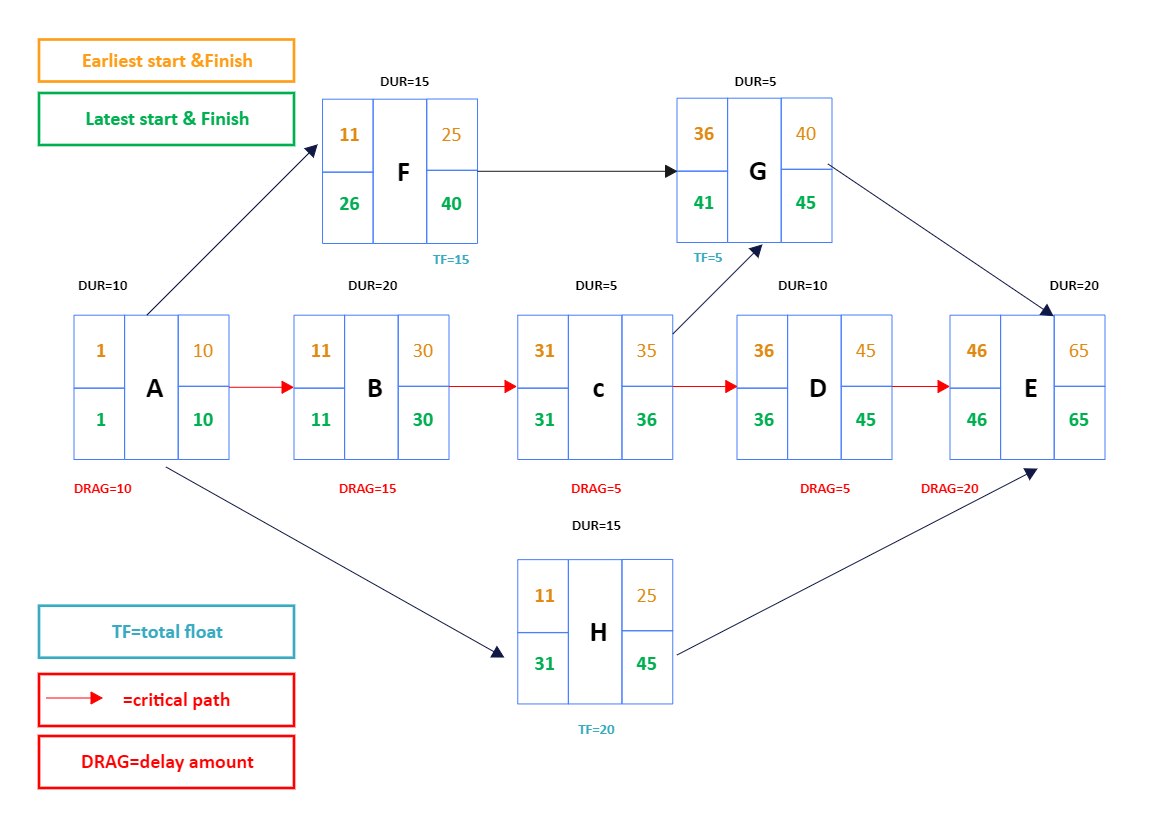
Stephen Devaux developed the critical path drag metric as part of the Total Project Control (TPC) approach to schedule analysis and compression in the critical path scheduling technique. Critical path activity or restrictions that add time to the project length is known as "critical path drag." Alternatively, it is the maximum amount of time an activity may be shortened until it no longer falls into the critical path or its duration becomes zero. The drag of a critical path activity is equal to whichever is less: its remaining duration or (if there are one or more parallel activities) the total float of the parallel activity with the least total float in networks in which all the dependencies are finish-to-start (FS) connections (i.e., where a predecessor must finish before a successor starts). An activity-on-node Precedence diagram template depicts the critical path timetable, value driver, and critical chain drag estimates. The crucial path is represented by activities A, B, C, D, and E, whereas activities F, G, and H are off the critical path, with floats of 15 days, five days, and 20 days, respectively. While activities off the critical path have a float and hence do not delay project completion, those on the critical route have critical path drag, which means they cause the project to be delayed. Because Activities A and E have no parallel activities, respectively, have a lag of 10 and 20 days. B and C run concurrently with F (float of 15) and H (float of 20). It has a duration of 20 seconds and a drag of 15 seconds (equivalent to F's float), while C has 20 seconds and drag of 15 seconds.


 Desktop