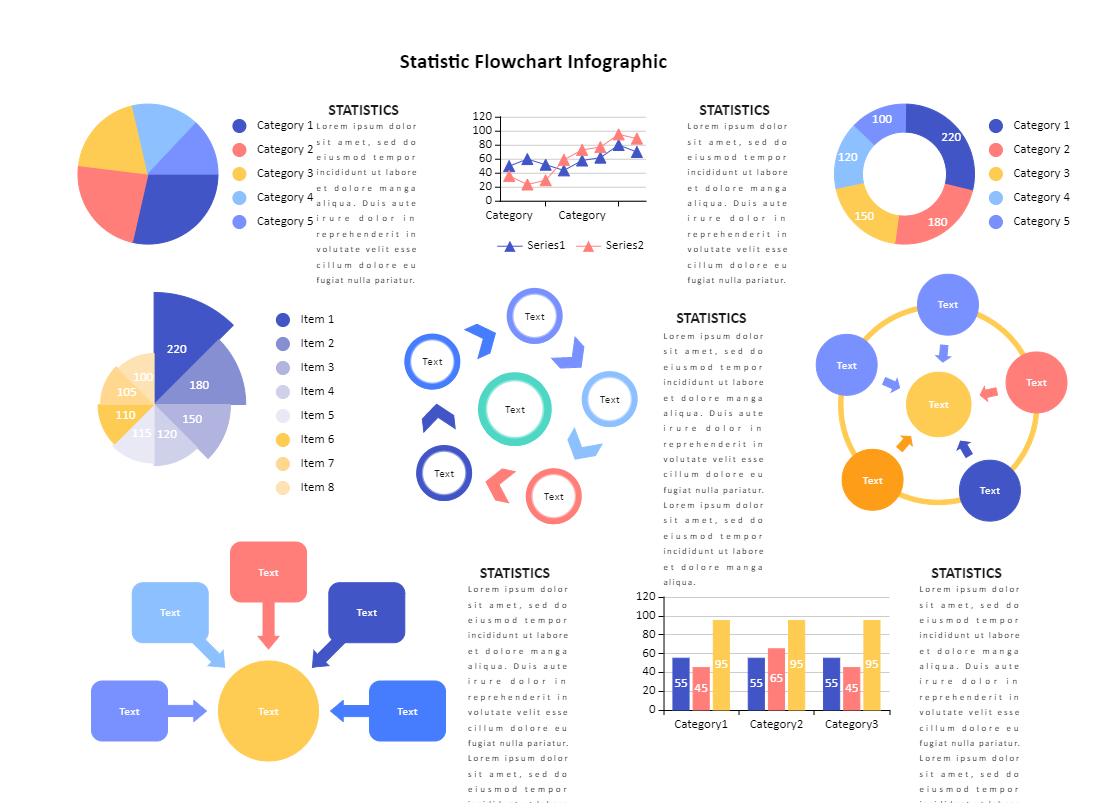
A Statistic Flowchart Infographic is a visual representation of your data. You can use charts, graphs, and texts to display these data. Therefore, a Statistic Flowchart Infographic is a perfect way to present a large amount of data. Whoever the reader, they will find it very easy and engaging.
On the other hand, presenting a large amount of data in spreadsheets can be a tiresome and challenging task. So, creating a Statistic Flowchart Infographic is the best option. Use some nice images, icons, and fonts while creating a Statistic Flowchart Infographic. You can use these Statistic Flowchart Infographics to display data such as world energy consumption, world population, USA sea trading overview, and many more.